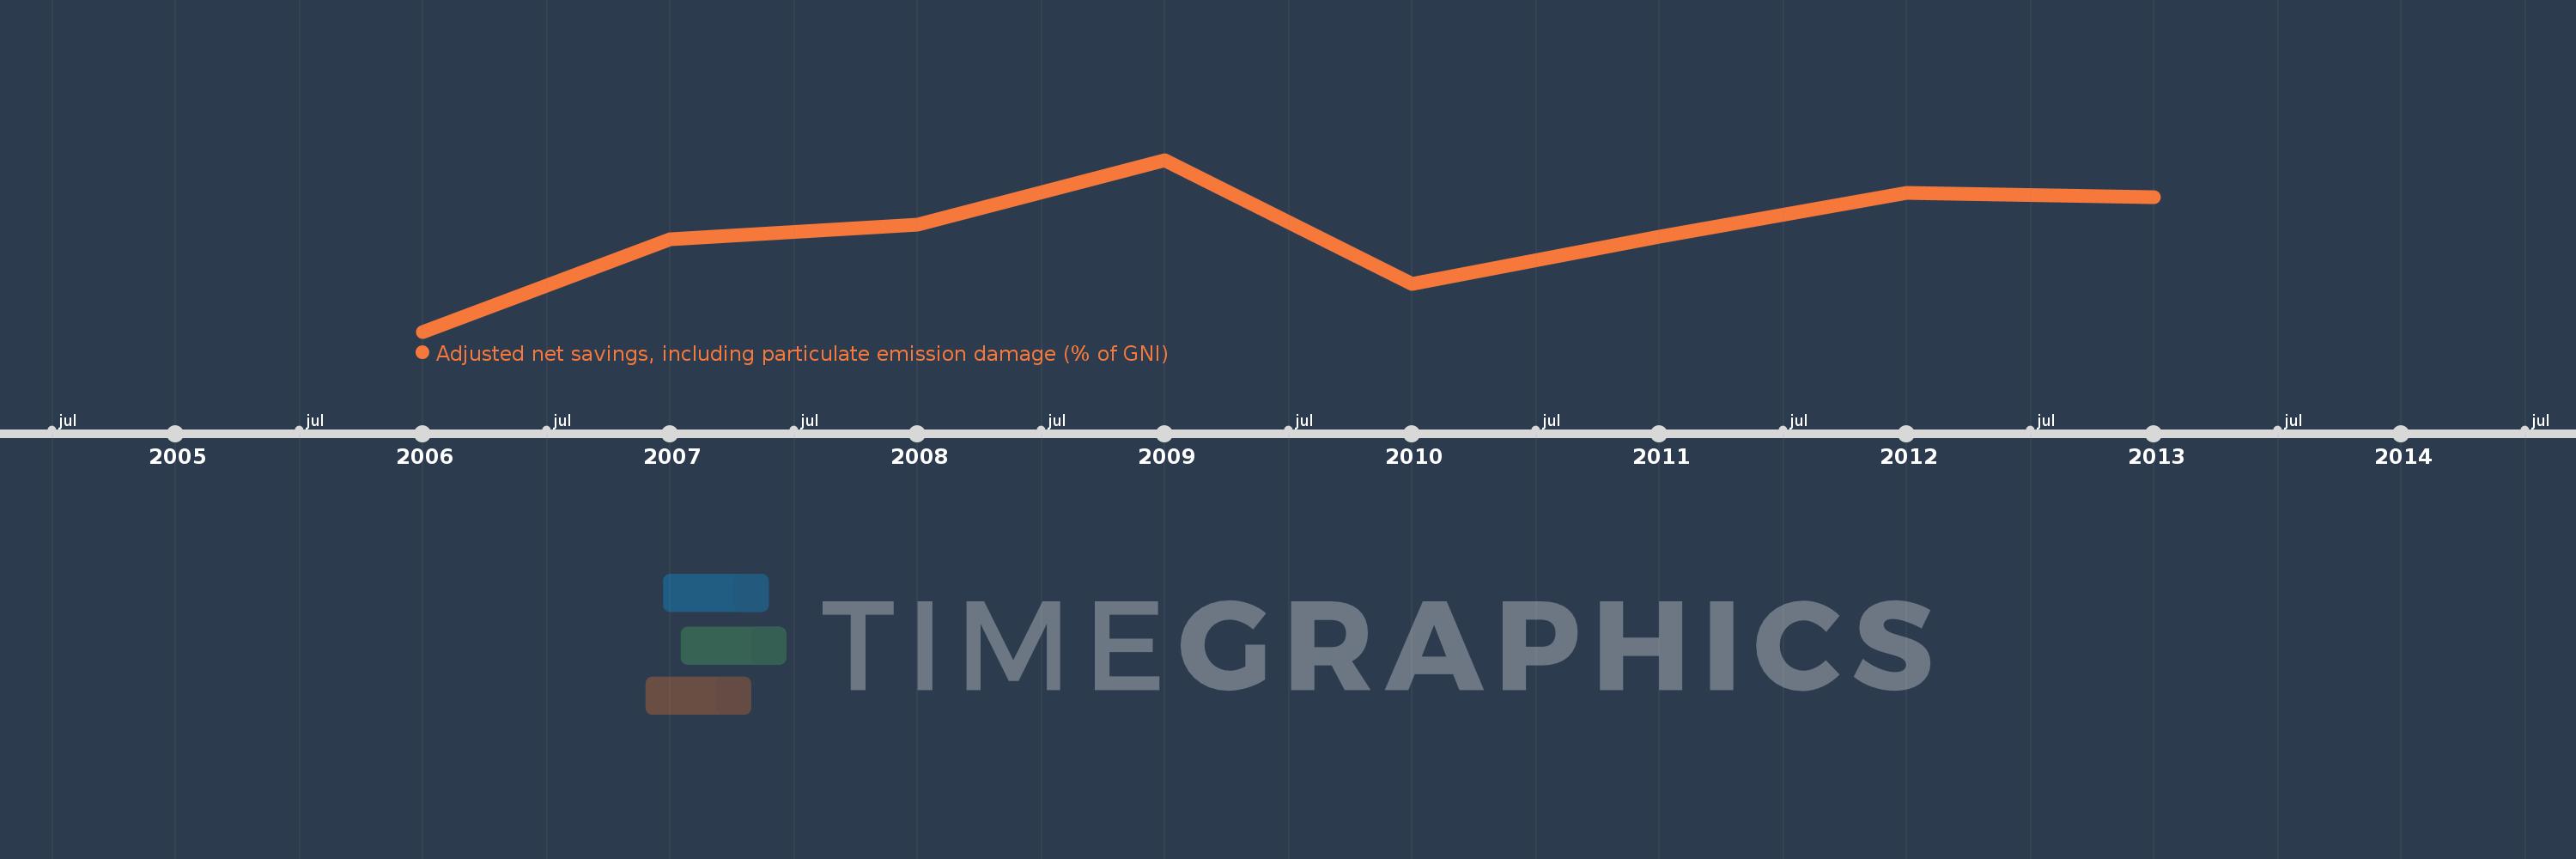
This timeline shows a graph from 2006 to 2013 of Iraq. No data until 2005. Number of actual observations by date: 8.
Source name:
World Development Indicators
Source organization:
World Bank staff estimates based on sources and methods in World Bank's "The Changing Wealth of Nations: Measuring Sustainable Development in the New Millennium" (2011).
Categories, topics:
Economy & Growth, Environment
Last updated:
apr 23, 2017
Indicators value changes by year
Meaning:
-7.549
Minimum:
-21.112
jan 1, 2006
Maximum:
2.577
jan 1, 2009
At the date of observation
Value
Absolute change
Change from the previous value
jan 1, 2006
-21.112
-21.112
0.0%
jan 1, 2007
-8.379
+12.733
-60.31%
jan 1, 2008
-6.39
+1.989
-23.74%
jan 1, 2009
2.577
+8.967
-140.32%
jan 1, 2010
-14.495
-17.071
-662.52%
jan 1, 2011
-7.984
+6.51
-44.91%
jan 1, 2012
-1.974
+6.01
-75.28%
jan 1, 2013
-2.631
-0.657
33.27%
Ranking of countries by current statistics by years