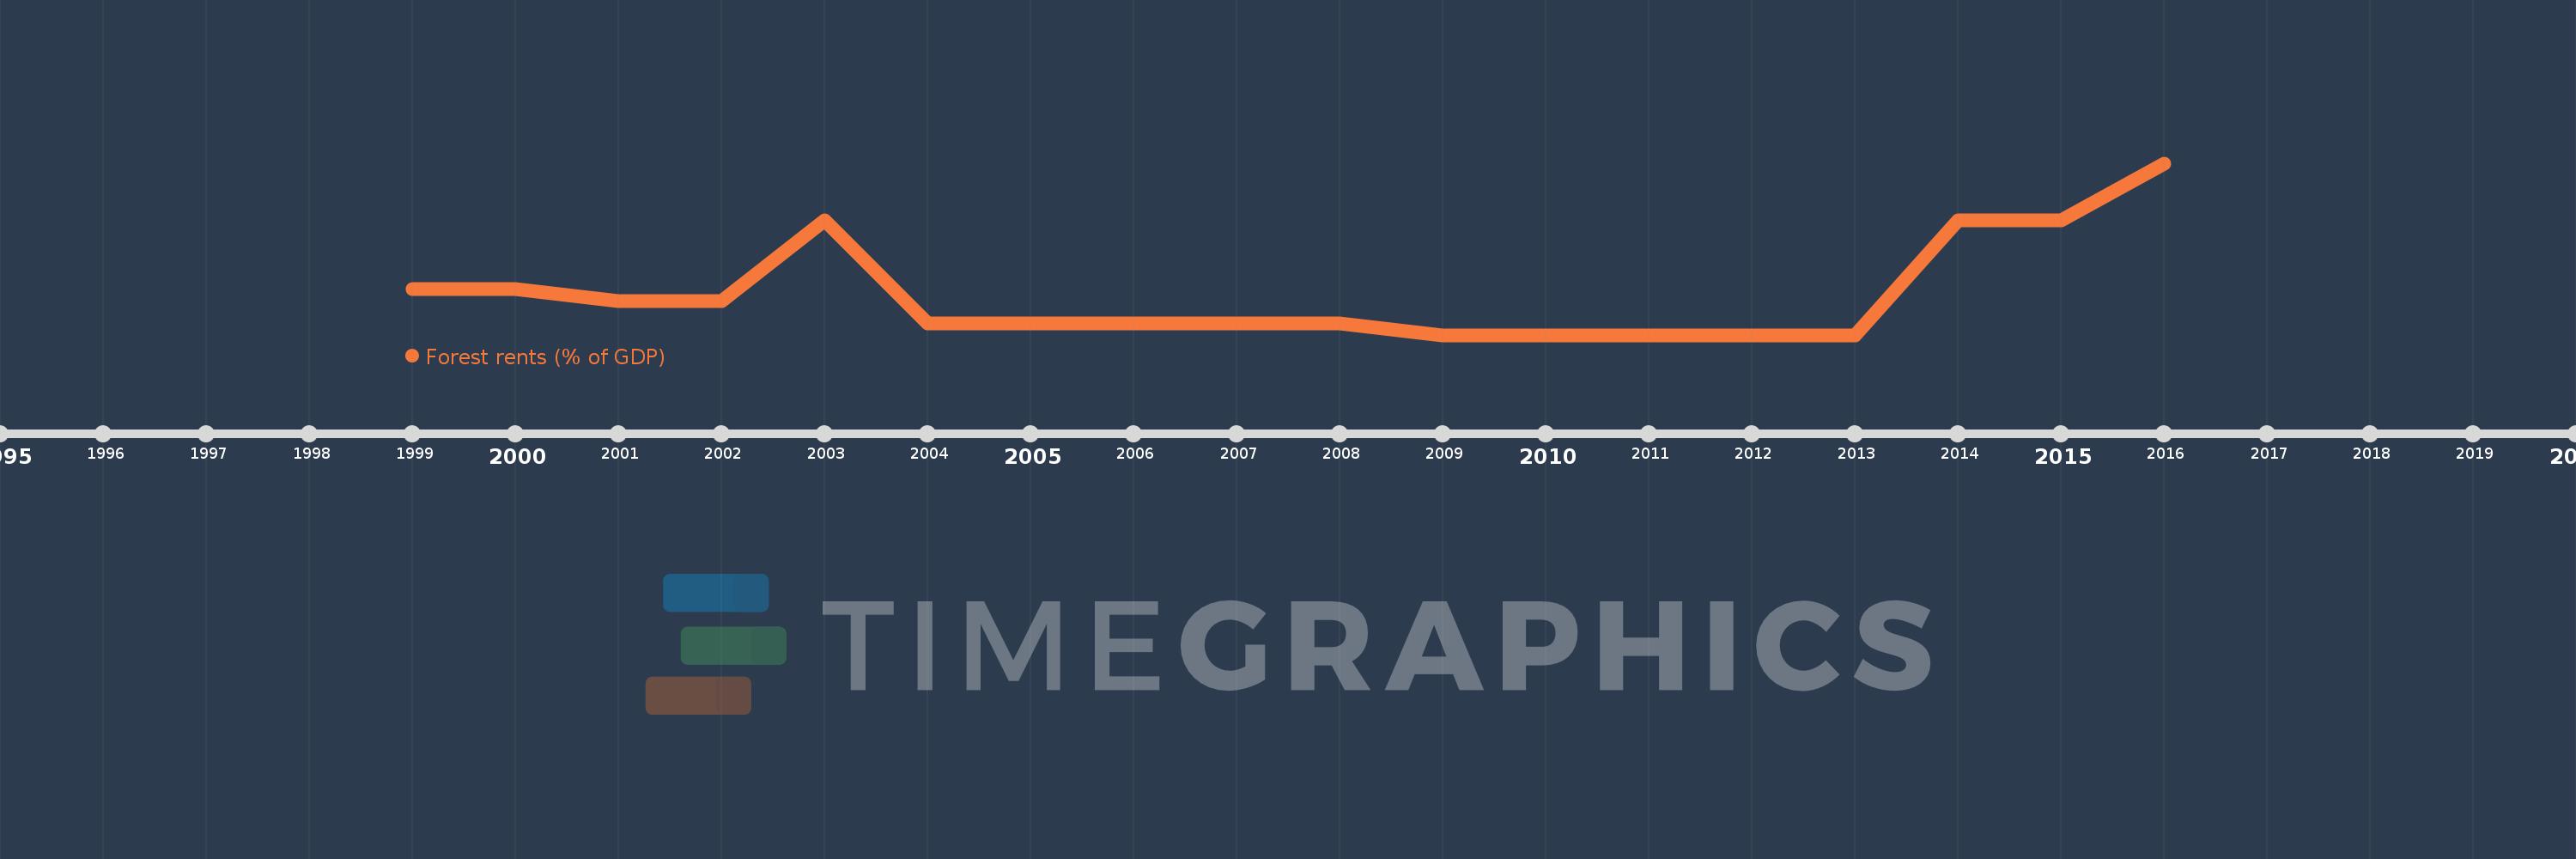
This timeline shows a graph from 1999 to 2016 of Azerbaijan. No data until 1998. Number of actual observations by date: 18.
Source name:
World Development Indicators
Source organization:
Estimates based on sources and methods described in "The Changing Wealth of Nations: Measuring Sustainable Development in the New Millennium" (World Bank, 2011).
Categories, topics:
Environment
Last updated:
apr 23, 2017
Indicators value changes by year
Meaning:
0.004
Minimum:
0.0
jan 1, 2013
Maximum:
0.015
jan 1, 2016
At the date of observation
Value
Absolute change
Change from the previous value
jan 1, 1999
0.004
+0.004
0.0%
jan 1, 2000
0.004
+0.0
1.2%
jan 1, 2001
0.003
-0.001
-13.94%
jan 1, 2002
0.003
-0.001
-17.08%
jan 1, 2003
0.01
+0.007
262.33%
jan 1, 2004
0.001
-0.008
-85.85%
jan 1, 2005
0.001
0.0
-5.51%
jan 1, 2006
0.001
0.0
-34.42%
jan 1, 2007
0.001
0.0
-22.23%
jan 1, 2008
0.001
0.0
-22.64%
jan 1, 2009
0.0
0.0
-23.35%
jan 1, 2010
0.0
0.0
-1.14%
jan 1, 2011
0.0
0.0
-17.34%
jan 1, 2012
0.0
+0.0
0.93%
jan 1, 2013
0.0
0.0
-12.08%
jan 1, 2014
0.01
+0.009
3.36K%
jan 1, 2015
0.01
+0.001
5.53%
jan 1, 2016
0.015
+0.005
48.58%
Ranking of countries by current statistics by years