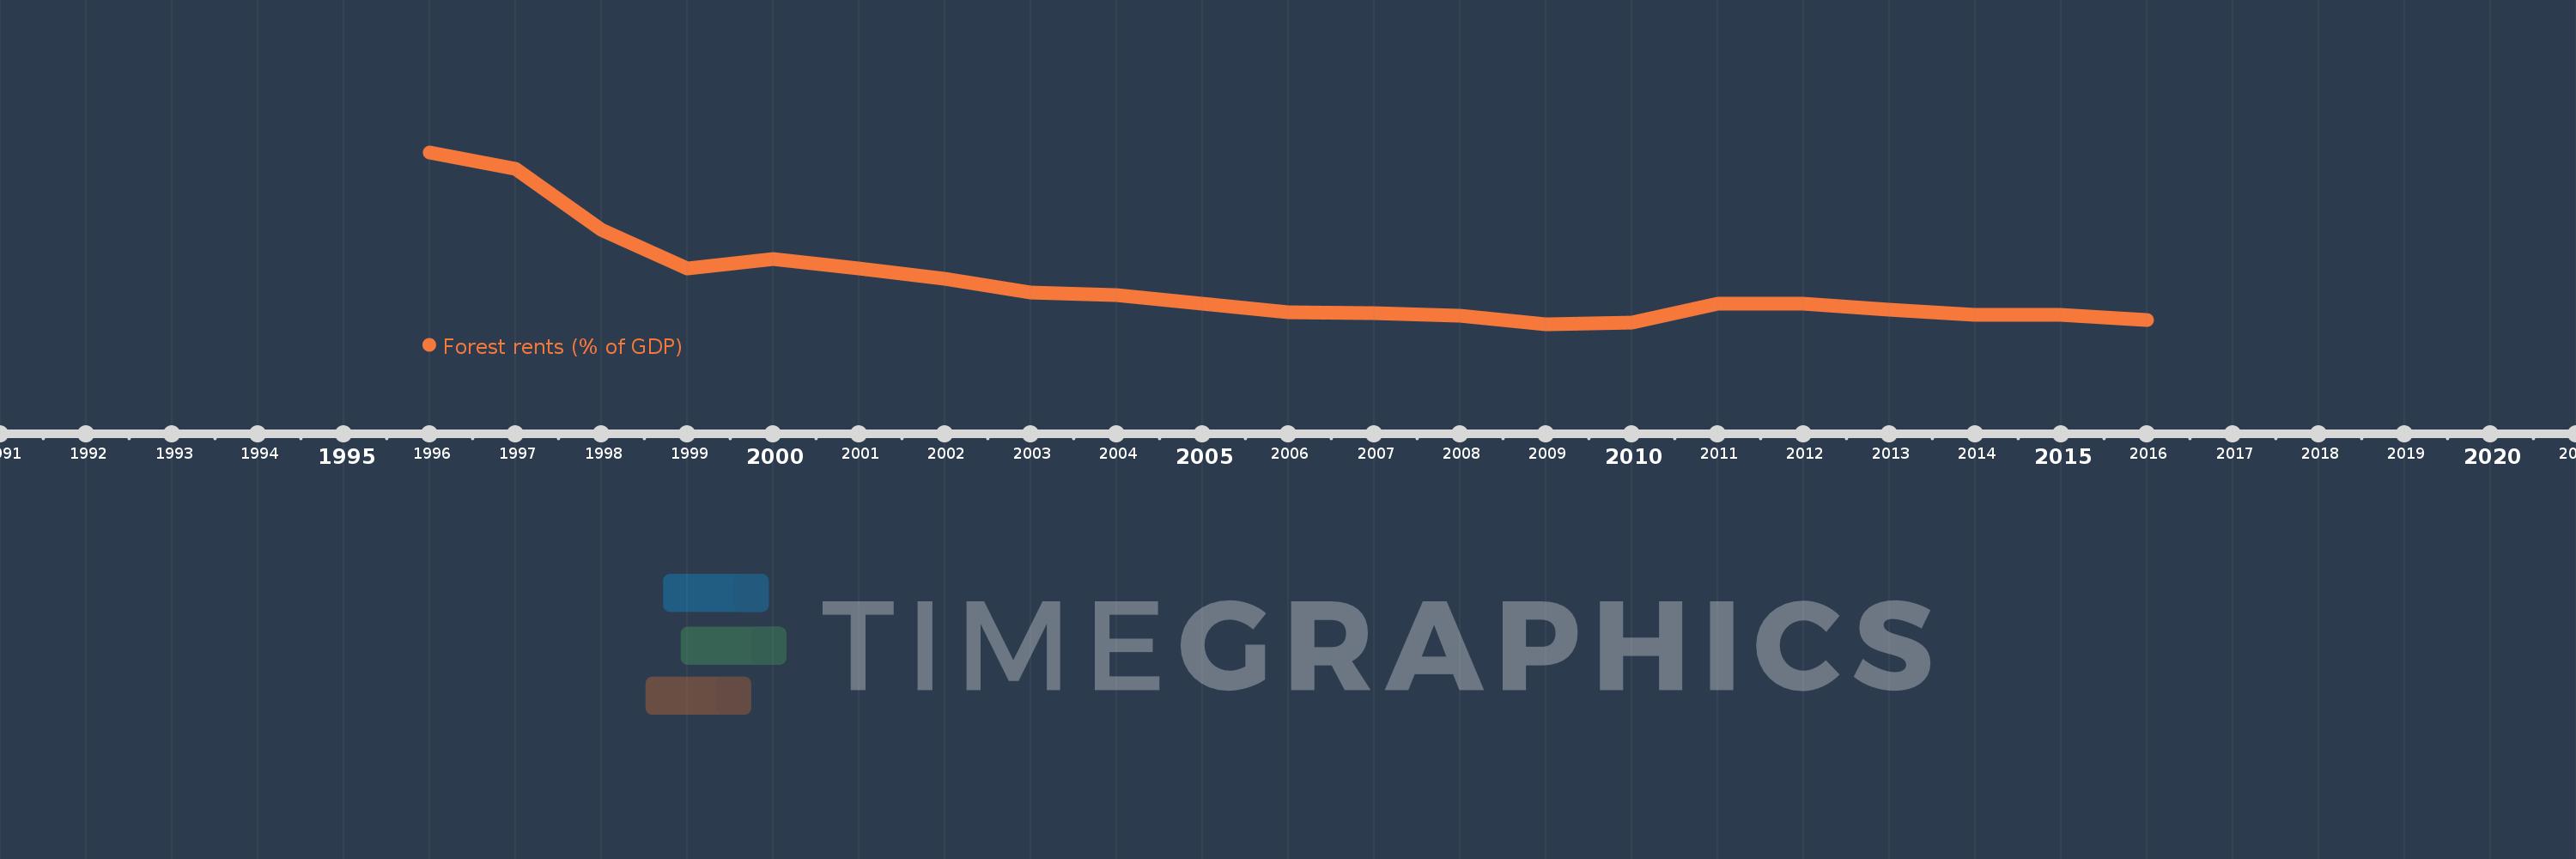
This timeline shows a graph from 1996 to 2016 of Lithuania. No data until 1995. Number of actual observations by date: 21.
Source name:
World Development Indicators
Source organization:
Estimates based on sources and methods described in "The Changing Wealth of Nations: Measuring Sustainable Development in the New Millennium" (World Bank, 2011).
Categories, topics:
Environment
Last updated:
apr 23, 2017
Indicators value changes by year
Meaning:
0.558
Minimum:
0.319
jan 1, 2009
Maximum:
1.351
jan 1, 1996
At the date of observation
Value
Absolute change
Change from the previous value
jan 1, 1996
1.351
+1.351
0.0%
jan 1, 1997
1.25
-0.101
-7.5%
jan 1, 1998
0.884
-0.367
-29.33%
jan 1, 1999
0.653
-0.23
-26.04%
jan 1, 2000
0.71
+0.057
8.69%
jan 1, 2001
0.656
-0.054
-7.58%
jan 1, 2002
0.593
-0.064
-9.69%
jan 1, 2003
0.51
-0.082
-13.91%
jan 1, 2004
0.495
-0.015
-3.01%
jan 1, 2005
0.441
-0.054
-10.87%
jan 1, 2006
0.39
-0.051
-11.5%
jan 1, 2007
0.385
-0.005
-1.28%
jan 1, 2008
0.368
-0.017
-4.42%
jan 1, 2009
0.319
-0.05
-13.51%
jan 1, 2010
0.33
+0.011
3.48%
jan 1, 2011
0.444
+0.115
34.76%
jan 1, 2012
0.441
-0.004
-0.8%
jan 1, 2013
0.406
-0.035
-7.84%
jan 1, 2014
0.377
-0.029
-7.22%
jan 1, 2015
0.374
-0.003
-0.75%
jan 1, 2016
0.343
-0.032
-8.44%
Ranking of countries by current statistics by years