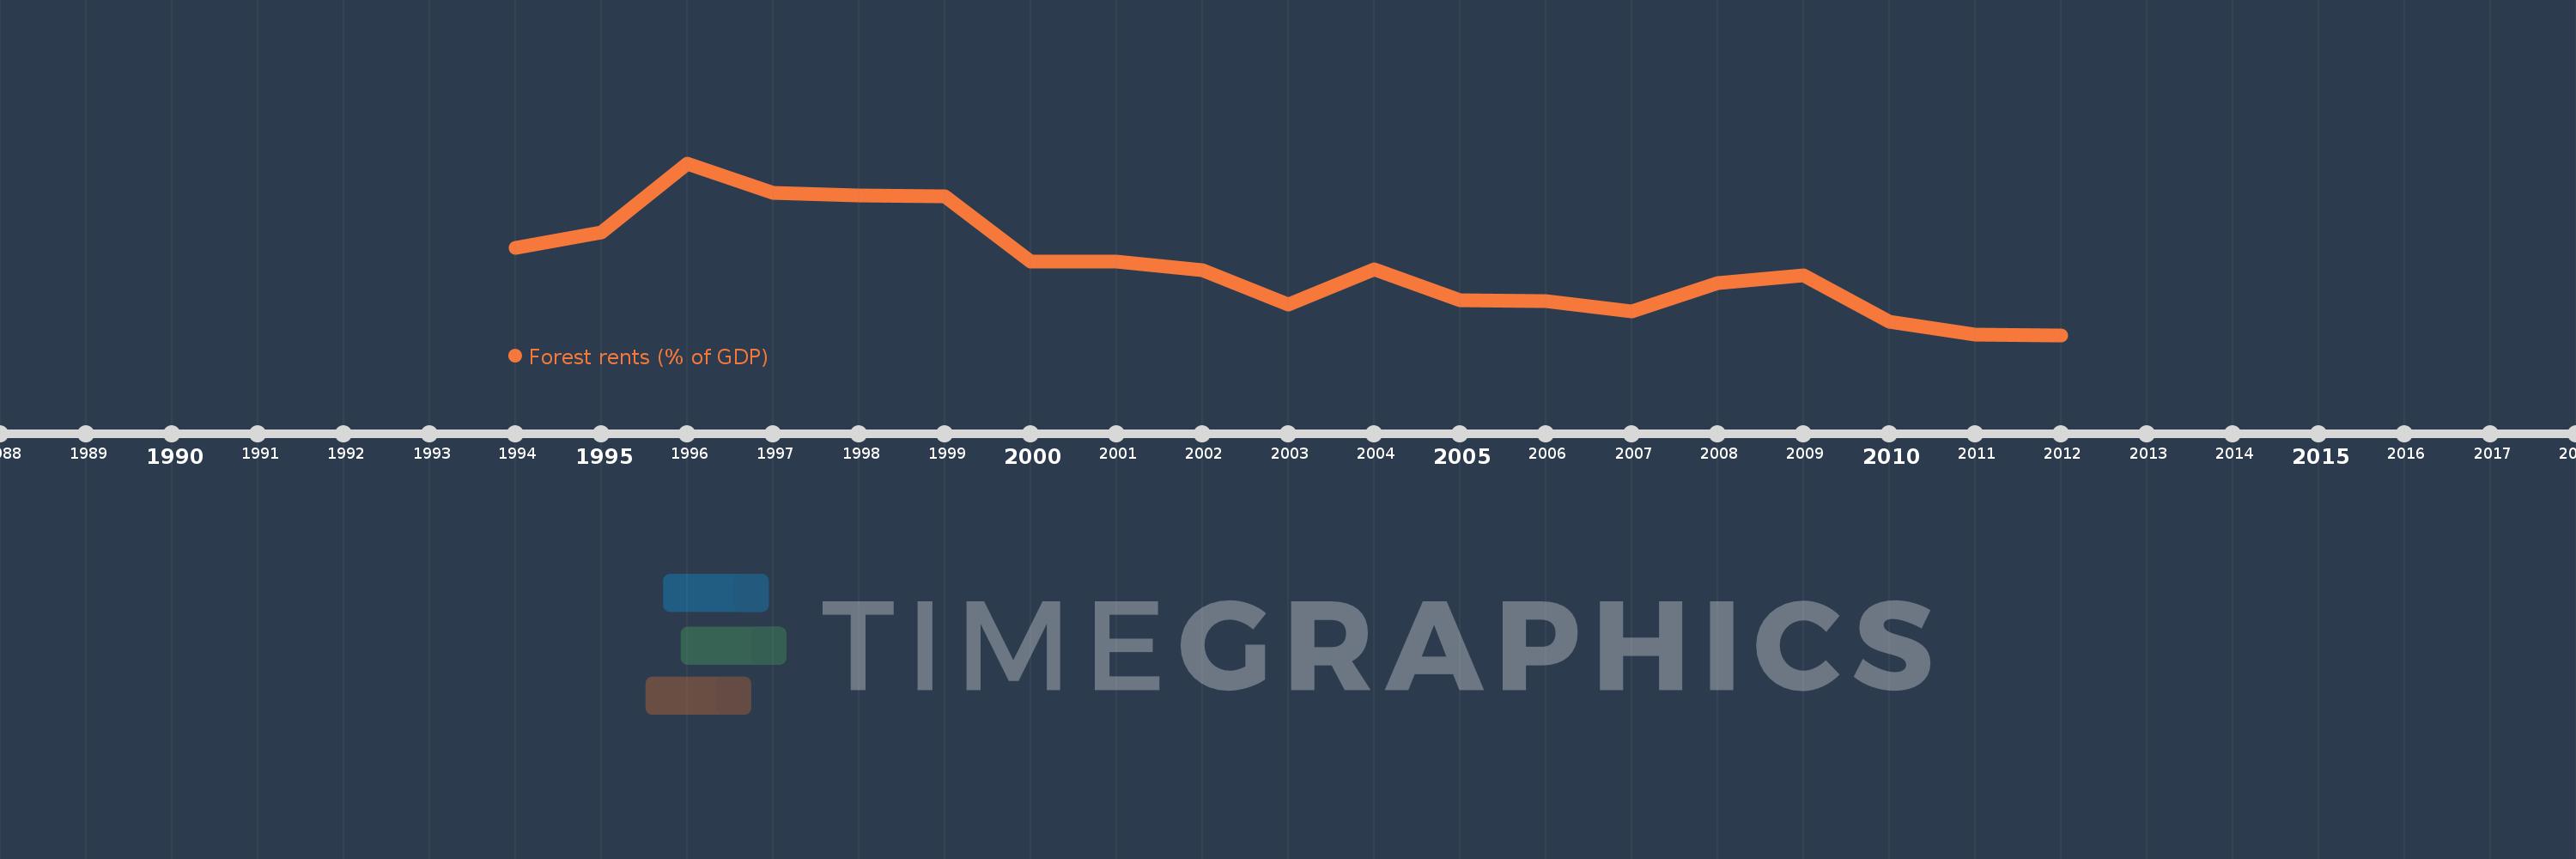
This timeline shows a graph from 1994 to 2012 of Eritrea. No data until 1993. Number of actual observations by date: 19.
Source name:
World Development Indicators
Source organization:
Estimates based on sources and methods described in "The Changing Wealth of Nations: Measuring Sustainable Development in the New Millennium" (World Bank, 2011).
Categories, topics:
Environment
Last updated:
apr 23, 2017
Indicators value changes by year
Meaning:
4.65
Minimum:
1.842
jan 1, 2012
Maximum:
8.851
jan 1, 1996
At the date of observation
Value
Absolute change
Change from the previous value
jan 1, 1994
5.389
+5.389
0.0%
jan 1, 1995
6.016
+0.627
11.63%
jan 1, 1996
8.851
+2.836
47.14%
jan 1, 1997
7.658
-1.193
-13.48%
jan 1, 1998
7.523
-0.135
-1.76%
jan 1, 1999
7.516
-0.007
-0.1%
jan 1, 2000
4.832
-2.684
-35.71%
jan 1, 2001
4.846
+0.014
0.29%
jan 1, 2002
4.485
-0.361
-7.44%
jan 1, 2003
3.098
-1.387
-30.92%
jan 1, 2004
4.53
+1.432
46.21%
jan 1, 2005
3.256
-1.274
-28.13%
jan 1, 2006
3.238
-0.018
-0.54%
jan 1, 2007
2.806
-0.432
-13.34%
jan 1, 2008
3.949
+1.143
40.72%
jan 1, 2009
4.267
+0.318
8.06%
jan 1, 2010
2.386
-1.881
-44.07%
jan 1, 2011
1.864
-0.522
-21.88%
jan 1, 2012
1.842
-0.022
-1.21%
Ranking of countries by current statistics by years