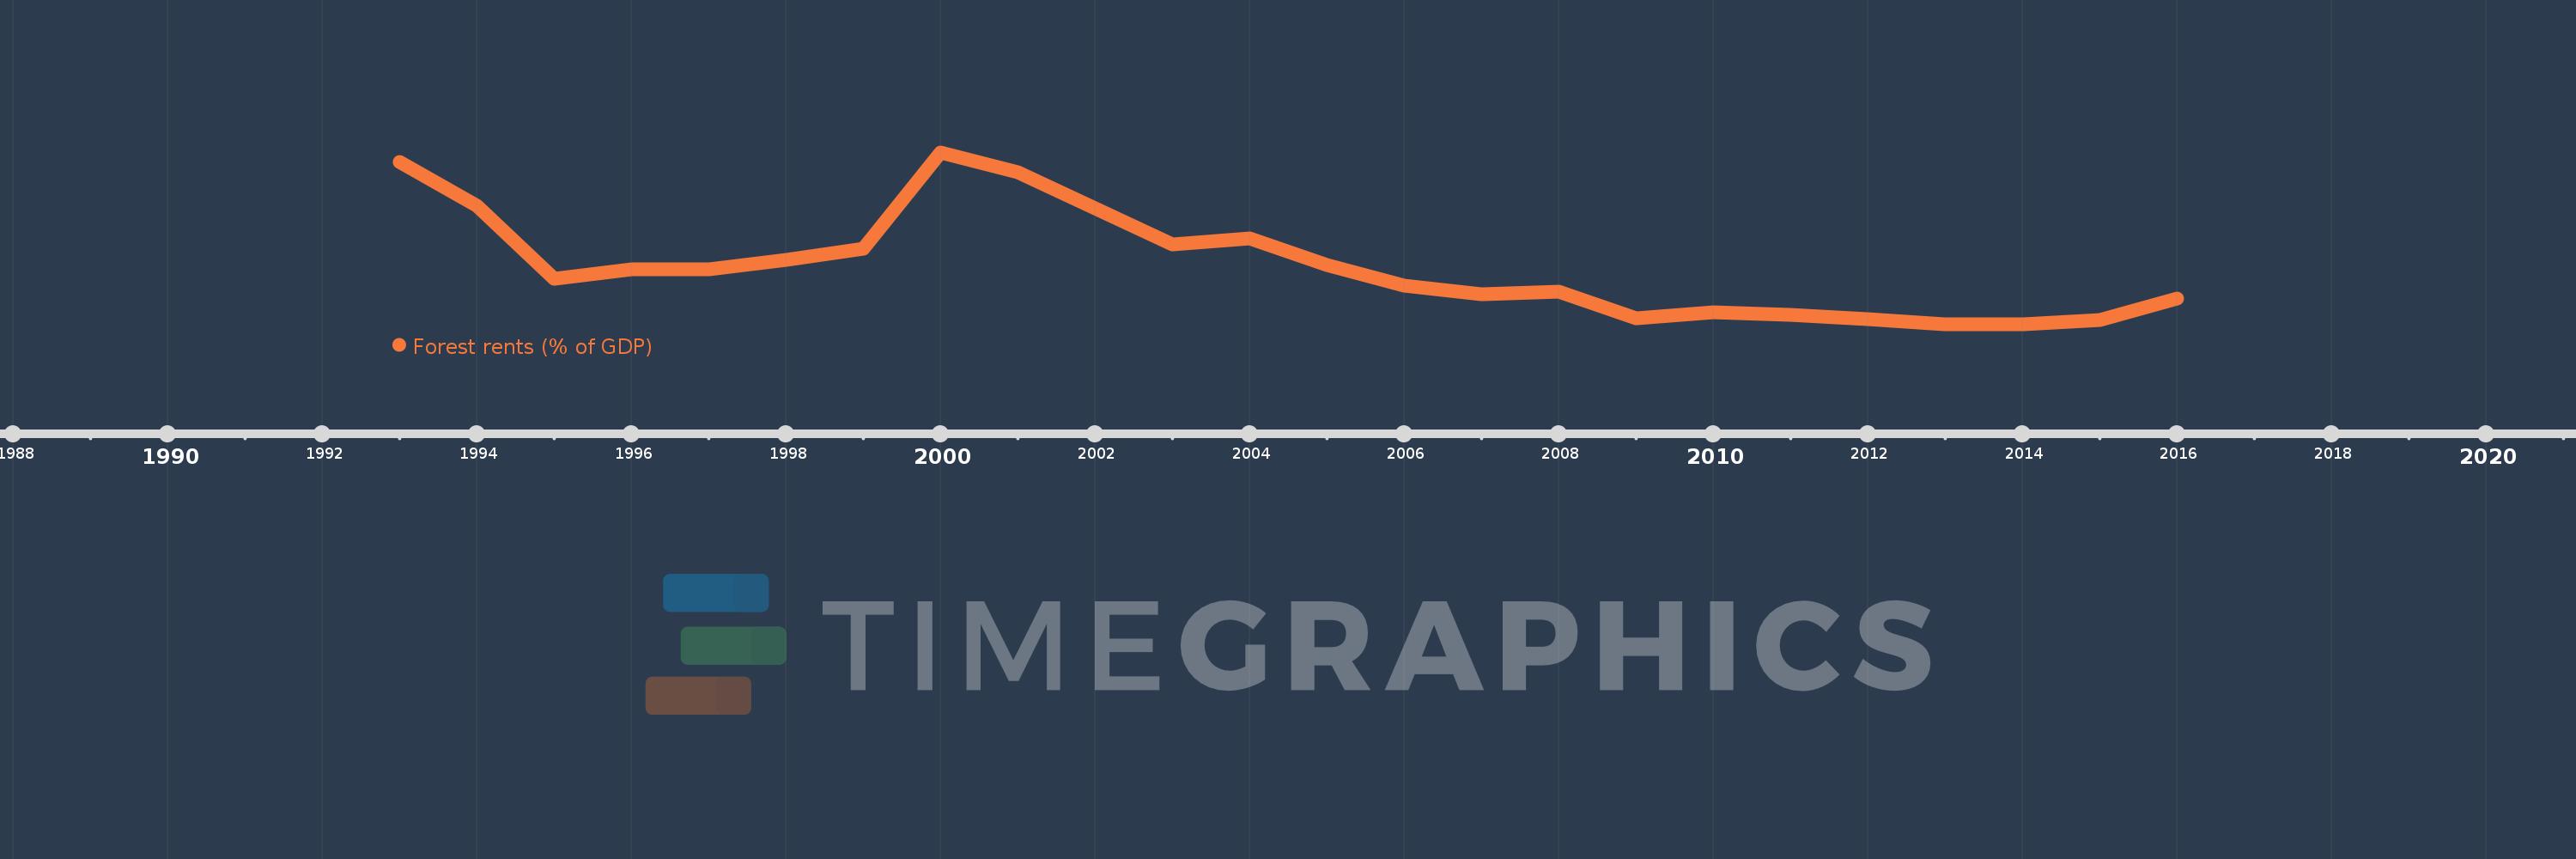
This timeline shows a graph from 1993 to 2016 of Russian Federation. No data until 1992. Number of actual observations by date: 24.
Source name:
World Development Indicators
Source organization:
Estimates based on sources and methods described in "The Changing Wealth of Nations: Measuring Sustainable Development in the New Millennium" (World Bank, 2011).
Categories, topics:
Environment
Last updated:
apr 23, 2017
Indicators value changes by year
Meaning:
0.489
Minimum:
0.236
jan 1, 2014
Maximum:
0.979
jan 1, 2000
At the date of observation
Value
Absolute change
Change from the previous value
jan 1, 1993
0.938
+0.938
0.0%
jan 1, 1994
0.749
-0.189
-20.11%
jan 1, 1995
0.432
-0.317
-42.38%
jan 1, 1996
0.475
+0.043
10.01%
jan 1, 1997
0.474
-0.001
-0.12%
jan 1, 1998
0.513
+0.038
8.07%
jan 1, 1999
0.561
+0.048
9.41%
jan 1, 2000
0.979
+0.419
74.64%
jan 1, 2001
0.893
-0.086
-8.77%
jan 1, 2002
0.737
-0.156
-17.47%
jan 1, 2003
0.582
-0.155
-21.08%
jan 1, 2004
0.606
+0.024
4.14%
jan 1, 2005
0.493
-0.113
-18.6%
jan 1, 2006
0.404
-0.089
-18.1%
jan 1, 2007
0.367
-0.037
-9.07%
jan 1, 2008
0.375
+0.008
2.05%
jan 1, 2009
0.263
-0.112
-29.85%
jan 1, 2010
0.289
+0.026
10.04%
jan 1, 2011
0.278
-0.011
-3.86%
jan 1, 2012
0.257
-0.022
-7.78%
jan 1, 2013
0.236
-0.02
-7.86%
jan 1, 2014
0.236
-0.001
-0.25%
jan 1, 2015
0.256
+0.02
8.42%
jan 1, 2016
0.346
+0.09
35.34%
Ranking of countries by current statistics by years