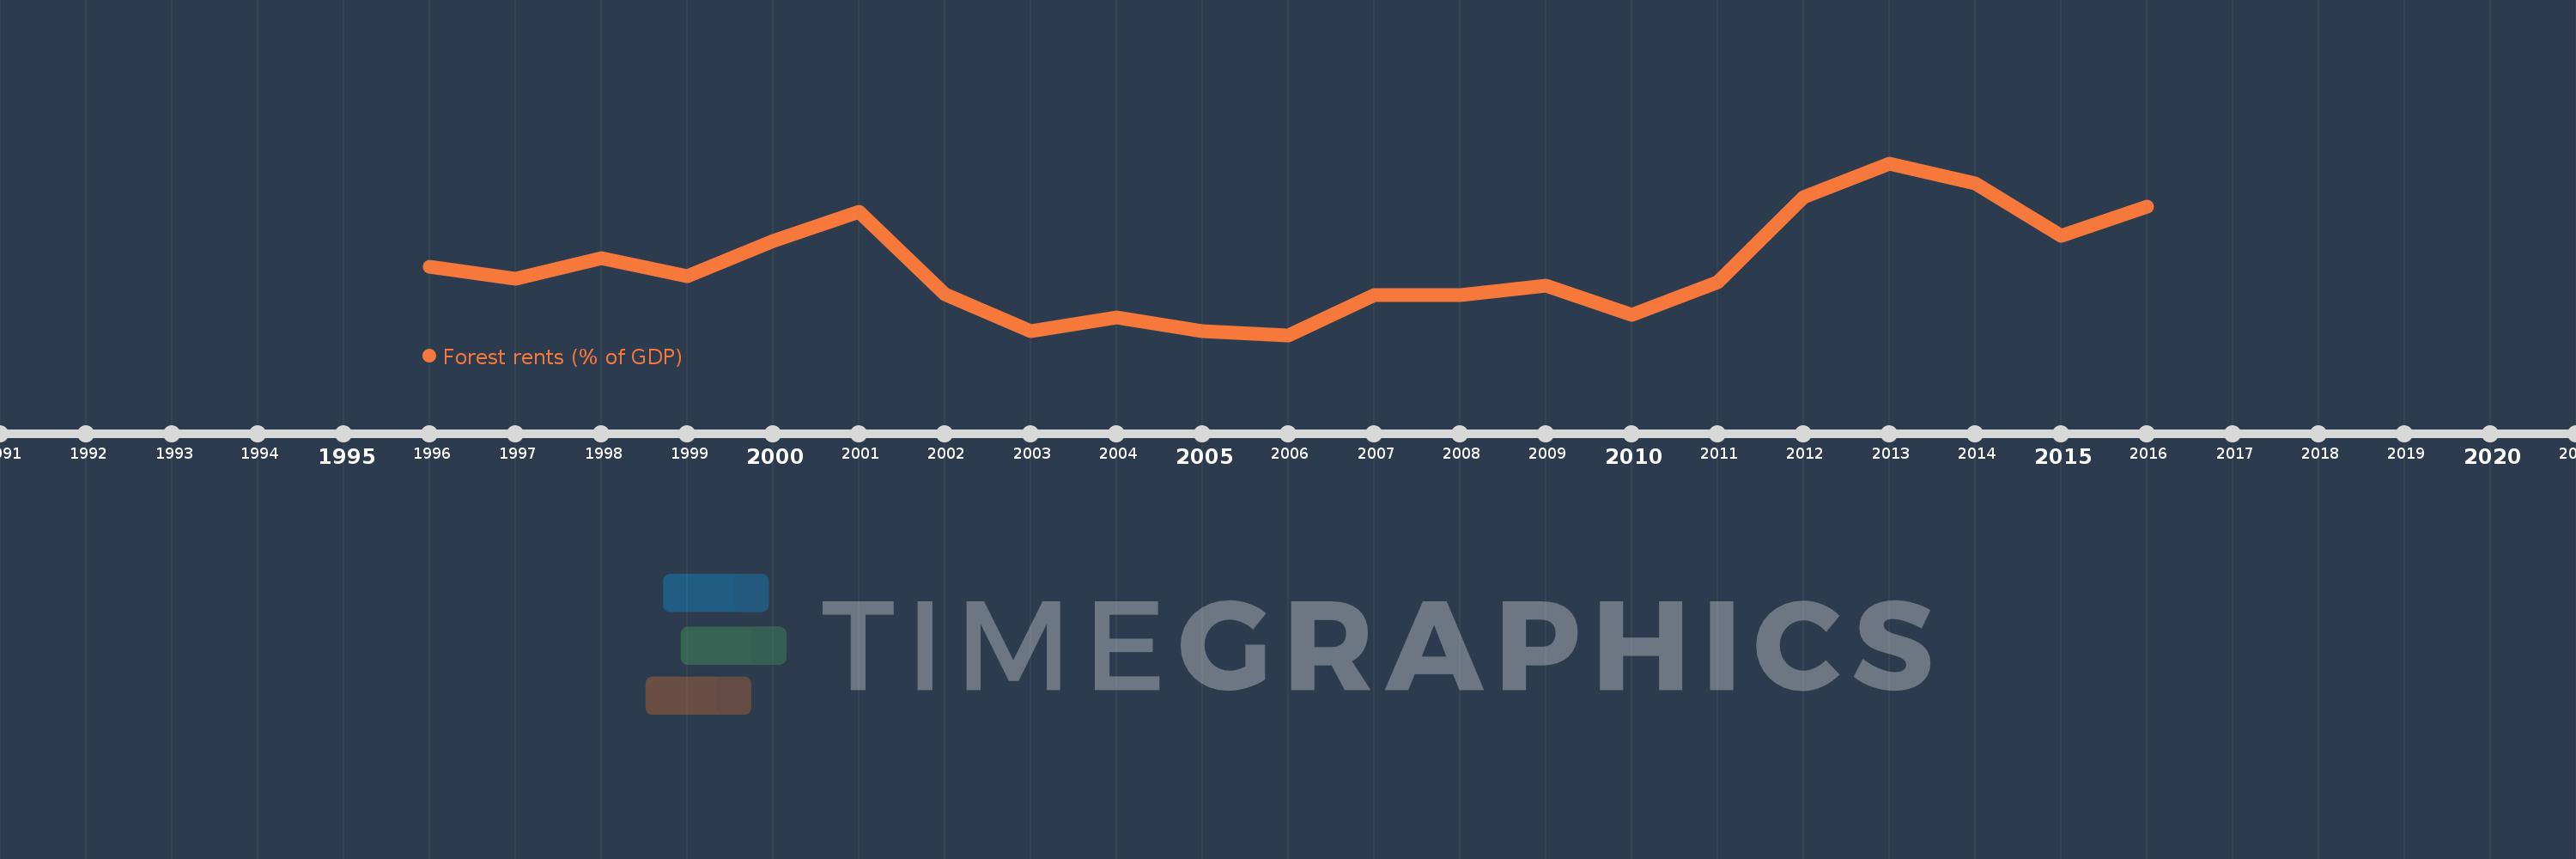
This timeline shows a graph from 1996 to 2016 of Croatia. No data until 1995. Number of actual observations by date: 21.
Source name:
World Development Indicators
Source organization:
Estimates based on sources and methods described in "The Changing Wealth of Nations: Measuring Sustainable Development in the New Millennium" (World Bank, 2011).
Categories, topics:
Environment
Last updated:
apr 23, 2017
Indicators value changes by year
Meaning:
0.227
Minimum:
0.169
jan 1, 2006
Maximum:
0.315
jan 1, 2013
At the date of observation
Value
Absolute change
Change from the previous value
jan 1, 1996
0.227
+0.227
0.0%
jan 1, 1997
0.217
-0.01
-4.24%
jan 1, 1998
0.234
+0.017
7.77%
jan 1, 1999
0.219
-0.015
-6.25%
jan 1, 2000
0.249
+0.03
13.66%
jan 1, 2001
0.274
+0.025
10.12%
jan 1, 2002
0.204
-0.071
-25.77%
jan 1, 2003
0.172
-0.031
-15.32%
jan 1, 2004
0.184
+0.011
6.64%
jan 1, 2005
0.172
-0.012
-6.27%
jan 1, 2006
0.169
-0.003
-1.76%
jan 1, 2007
0.203
+0.034
19.88%
jan 1, 2008
0.203
0.0
-0.08%
jan 1, 2009
0.211
+0.008
4.08%
jan 1, 2010
0.186
-0.025
-11.84%
jan 1, 2011
0.214
+0.028
15.23%
jan 1, 2012
0.286
+0.072
33.47%
jan 1, 2013
0.315
+0.029
9.99%
jan 1, 2014
0.298
-0.017
-5.36%
jan 1, 2015
0.253
-0.045
-15.17%
jan 1, 2016
0.278
+0.025
9.98%
Ranking of countries by current statistics by years