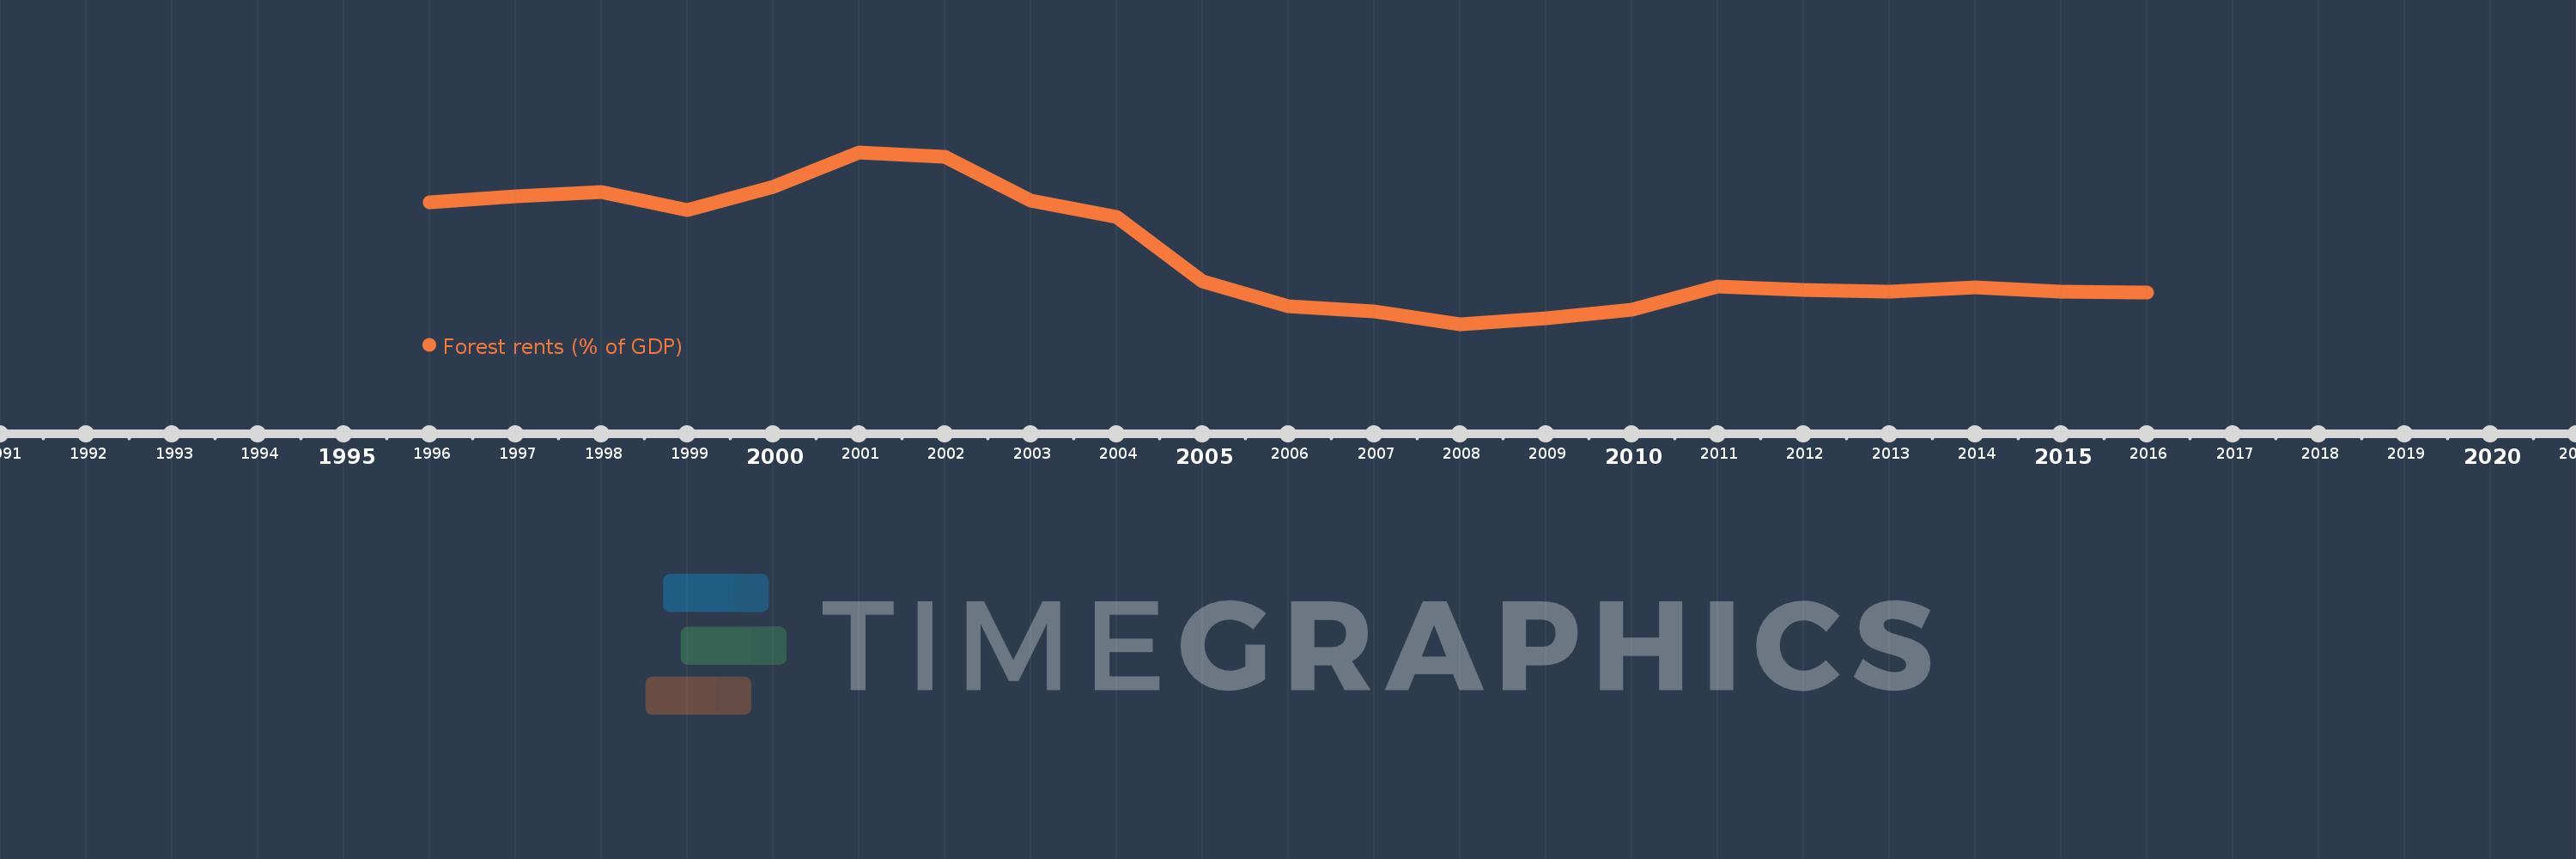
This timeline shows a graph from 1996 to 2016 of Estonia. No data until 1995. Number of actual observations by date: 21.
Source name:
World Development Indicators
Source organization:
Estimates based on sources and methods described in "The Changing Wealth of Nations: Measuring Sustainable Development in the New Millennium" (World Bank, 2011).
Categories, topics:
Environment
Last updated:
apr 23, 2017
Indicators value changes by year
Meaning:
1.176
Minimum:
0.459
jan 1, 2008
Maximum:
2.179
jan 1, 2001
At the date of observation
Value
Absolute change
Change from the previous value
jan 1, 1996
1.683
+1.683
0.0%
jan 1, 1997
1.742
+0.059
3.48%
jan 1, 1998
1.779
+0.038
2.16%
jan 1, 1999
1.603
-0.176
-9.91%
jan 1, 2000
1.836
+0.232
14.5%
jan 1, 2001
2.179
+0.344
18.72%
jan 1, 2002
2.137
-0.042
-1.92%
jan 1, 2003
1.698
-0.439
-20.55%
jan 1, 2004
1.53
-0.168
-9.9%
jan 1, 2005
0.885
-0.645
-42.14%
jan 1, 2006
0.638
-0.248
-27.98%
jan 1, 2007
0.59
-0.048
-7.51%
jan 1, 2008
0.459
-0.131
-22.2%
jan 1, 2009
0.515
+0.057
12.36%
jan 1, 2010
0.605
+0.089
17.31%
jan 1, 2011
0.834
+0.229
37.9%
jan 1, 2012
0.806
-0.028
-3.4%
jan 1, 2013
0.788
-0.017
-2.13%
jan 1, 2014
0.831
+0.042
5.36%
jan 1, 2015
0.789
-0.041
-4.99%
jan 1, 2016
0.774
-0.015
-1.92%
Ranking of countries by current statistics by years