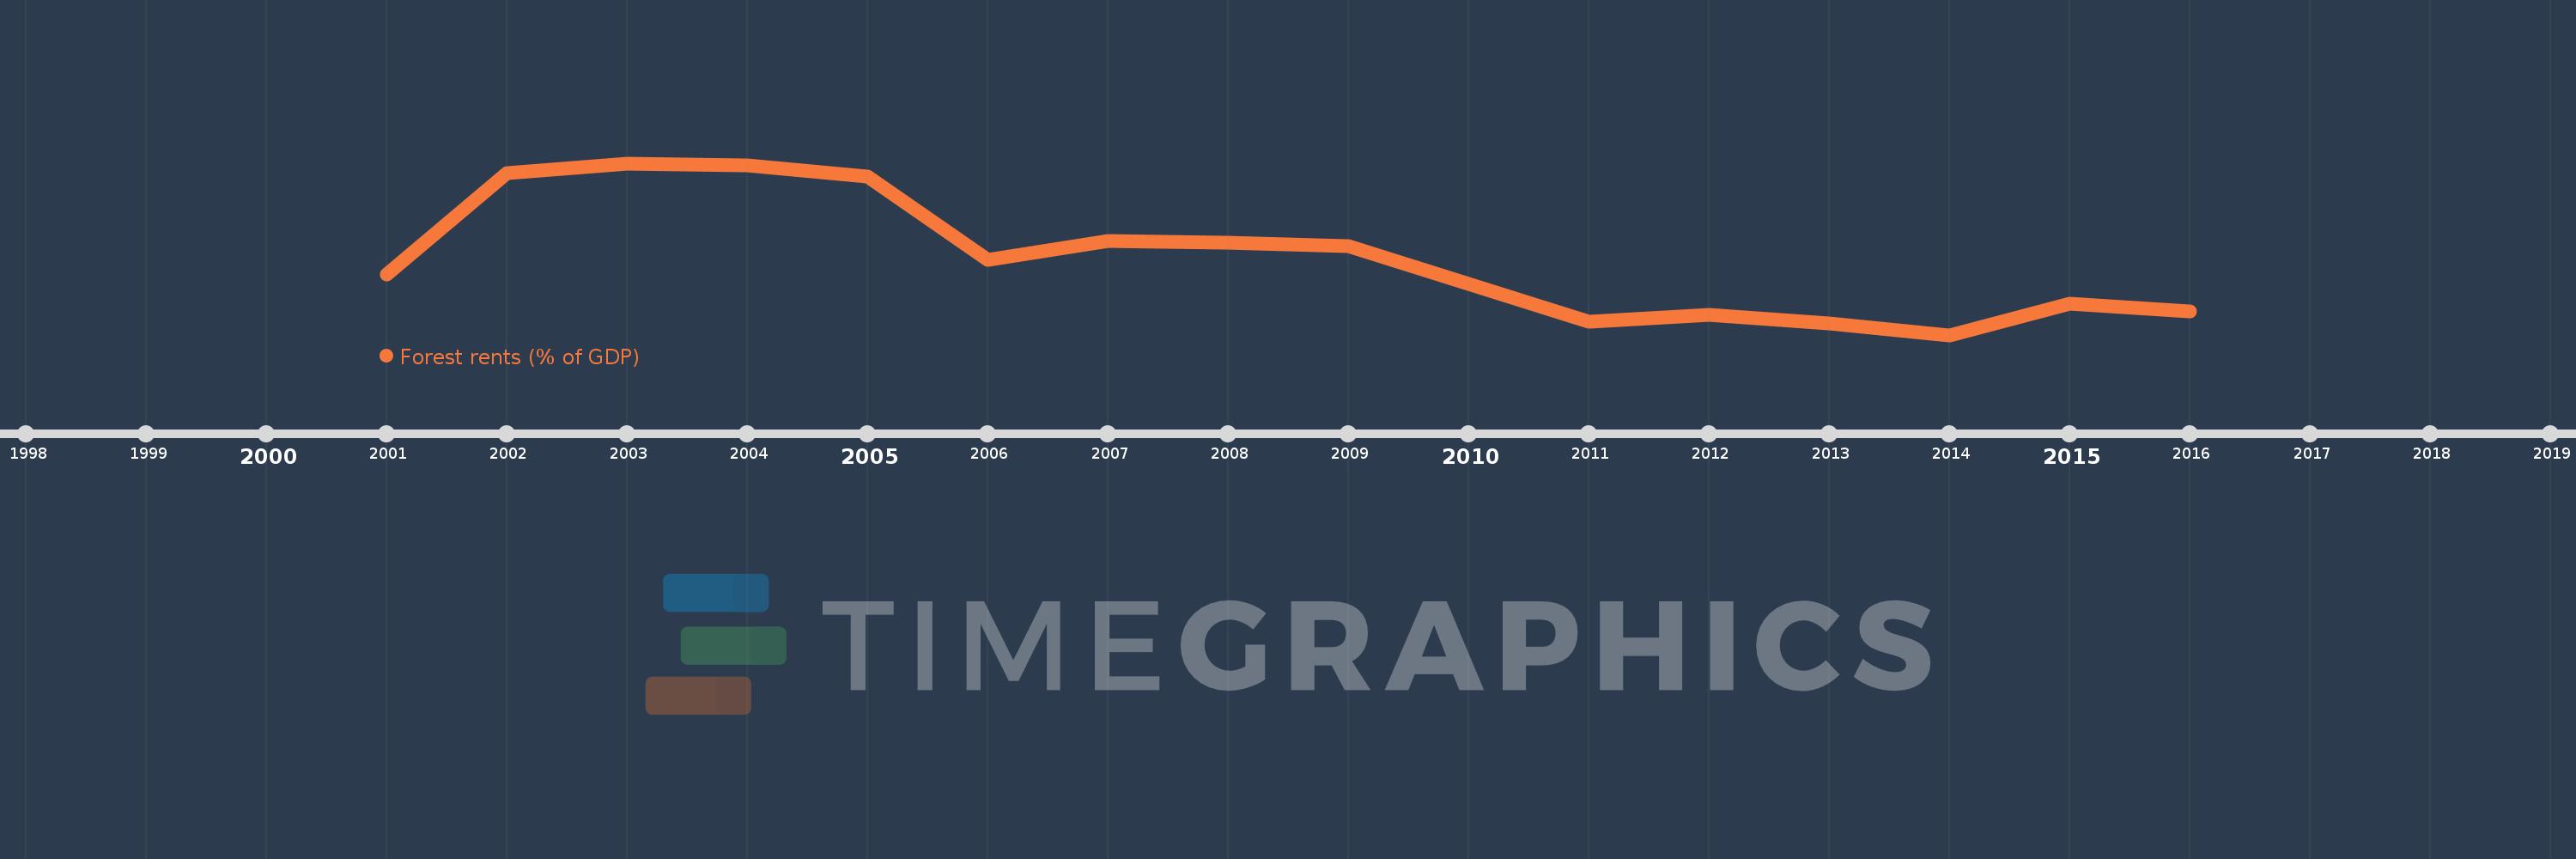
This timeline shows a graph from 2001 to 2016 of Myanmar. No data until 2000. Number of actual observations by date: 16.
Source name:
World Development Indicators
Source organization:
Estimates based on sources and methods described in "The Changing Wealth of Nations: Measuring Sustainable Development in the New Millennium" (World Bank, 2011).
Categories, topics:
Environment
Last updated:
apr 23, 2017
Indicators value changes by year
Meaning:
5.114
Minimum:
2.872
jan 1, 2014
Maximum:
7.908
jan 1, 2003
At the date of observation
Value
Absolute change
Change from the previous value
jan 1, 2001
4.656
+4.656
0.0%
jan 1, 2002
7.626
+2.97
63.8%
jan 1, 2003
7.908
+0.282
3.69%
jan 1, 2004
7.836
-0.072
-0.91%
jan 1, 2005
7.526
-0.309
-3.95%
jan 1, 2006
5.071
-2.456
-32.63%
jan 1, 2007
5.634
+0.563
11.11%
jan 1, 2008
5.573
-0.061
-1.08%
jan 1, 2009
5.479
-0.094
-1.68%
jan 1, 2010
4.361
-1.118
-20.4%
jan 1, 2011
3.26
-1.101
-25.25%
jan 1, 2012
3.463
+0.202
6.21%
jan 1, 2013
3.204
-0.258
-7.46%
jan 1, 2014
2.872
-0.332
-10.36%
jan 1, 2015
3.795
+0.923
32.14%
jan 1, 2016
3.552
-0.243
-6.4%
Ranking of countries by current statistics by years