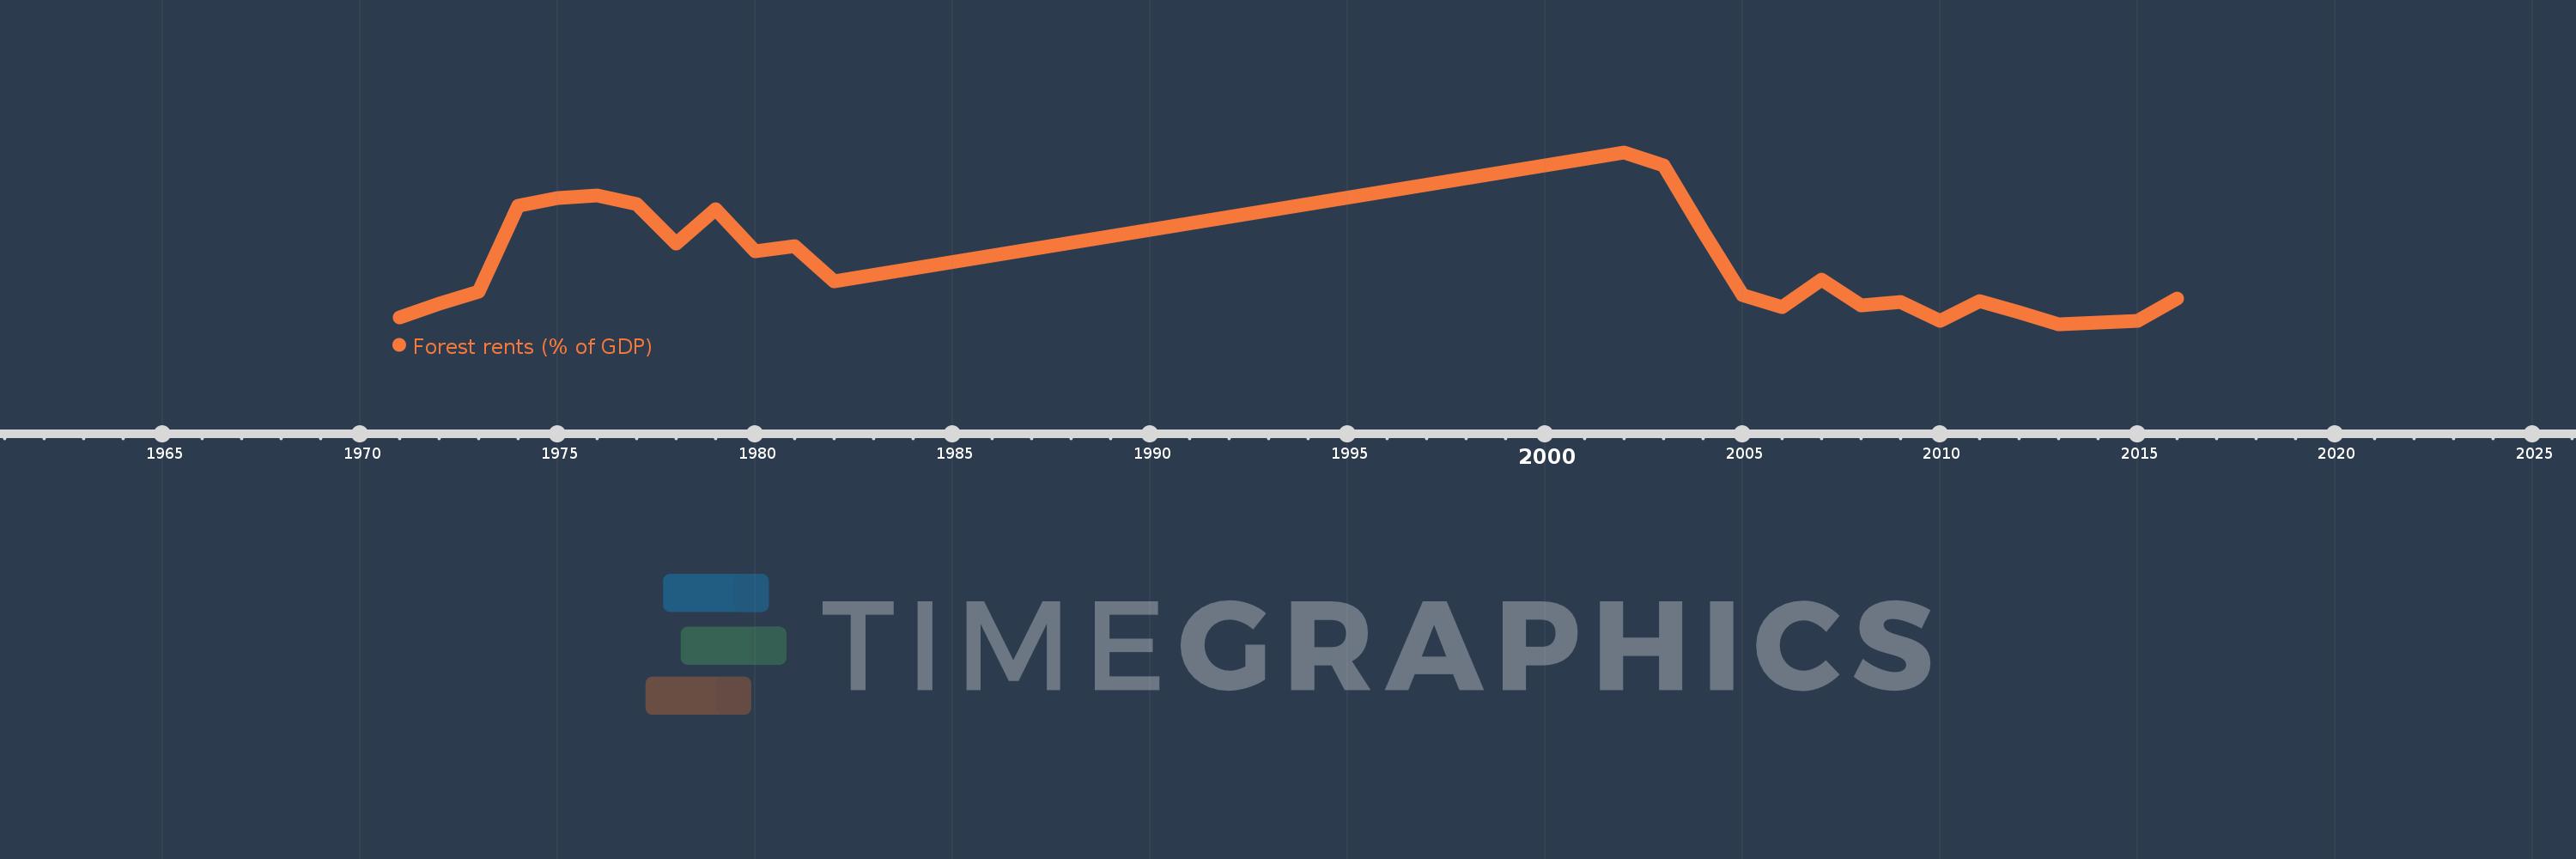
This timeline shows a graph from 1971 to 2016 of Afghanistan. No data until 1970. Number of actual observations by date: 27.
Source name:
World Development Indicators
Source organization:
Estimates based on sources and methods described in "The Changing Wealth of Nations: Measuring Sustainable Development in the New Millennium" (World Bank, 2011).
Categories, topics:
Environment
Last updated:
apr 23, 2017
Indicators value changes by year
Meaning:
0.507
Minimum:
0.257
jan 1, 2013
Maximum:
0.997
jan 1, 2002
At the date of observation
Value
Absolute change
Change from the previous value
jan 1, 1971
0.285
+0.285
0.0%
jan 1, 1972
0.345
+0.059
20.85%
jan 1, 1973
0.398
+0.053
15.51%
jan 1, 1974
0.768
+0.37
93.01%
jan 1, 1975
0.8
+0.032
4.17%
jan 1, 1976
0.813
+0.013
1.59%
jan 1, 1977
0.773
-0.039
-4.85%
jan 1, 1978
0.603
-0.171
-22.08%
jan 1, 1979
0.751
+0.148
24.59%
jan 1, 1980
0.572
-0.179
-23.85%
jan 1, 1981
0.594
+0.022
3.83%
jan 1, 1982
0.443
-0.15
-25.32%
jan 1, 2002
0.997
+0.554
124.89%
jan 1, 2003
0.942
-0.055
-5.52%
jan 1, 2004
0.655
-0.287
-30.46%
jan 1, 2005
0.384
-0.272
-41.46%
jan 1, 2006
0.329
-0.055
-14.28%
jan 1, 2007
0.448
+0.119
36.28%
jan 1, 2008
0.339
-0.109
-24.34%
jan 1, 2009
0.351
+0.012
3.42%
jan 1, 2010
0.273
-0.077
-22.03%
jan 1, 2011
0.358
+0.084
30.84%
jan 1, 2012
0.307
-0.051
-14.13%
jan 1, 2013
0.257
-0.05
-16.2%
jan 1, 2014
0.265
+0.008
3.08%
jan 1, 2015
0.271
+0.006
2.29%
jan 1, 2016
0.367
+0.095
35.07%
Ranking of countries by current statistics by years