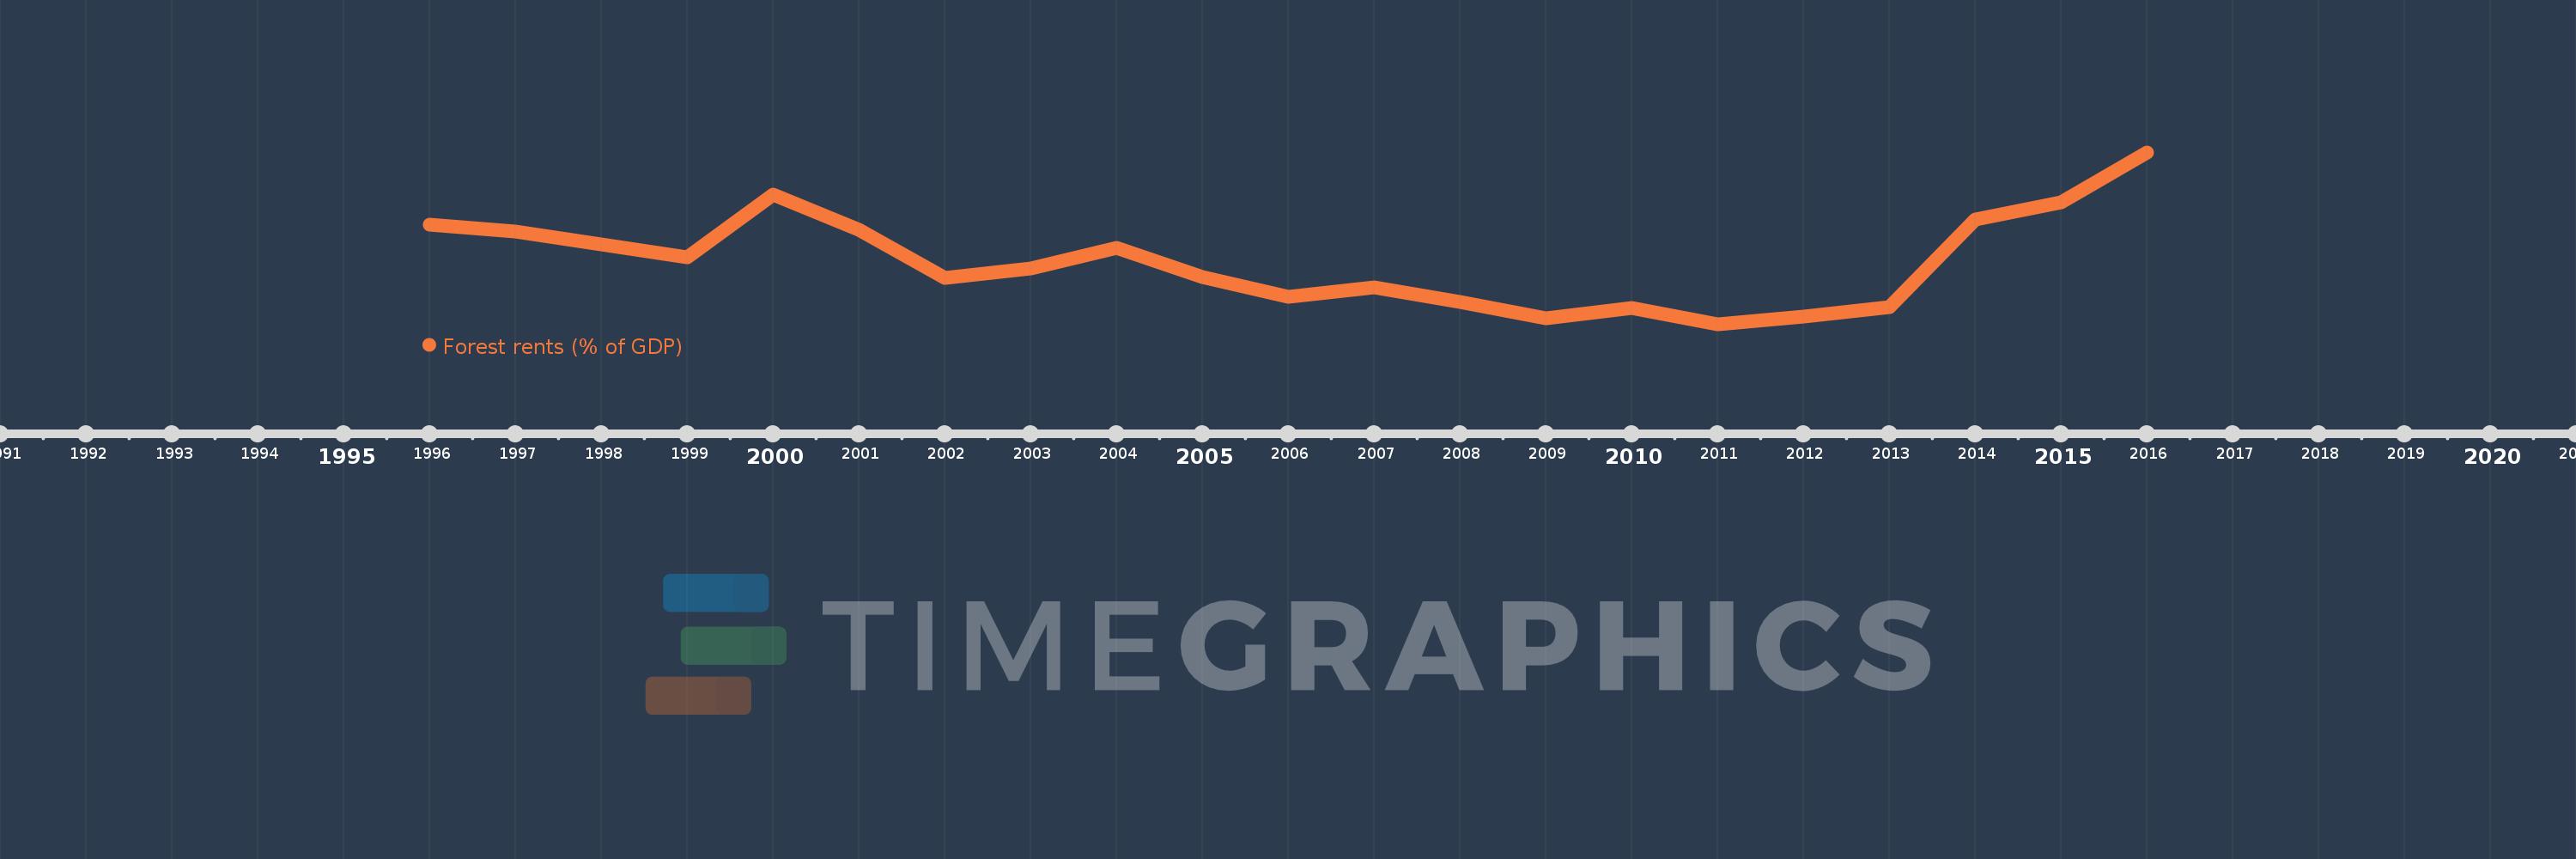
This timeline shows a graph from 1996 to 2016 of Moldova. No data until 1995. Number of actual observations by date: 21.
Source name:
World Development Indicators
Source organization:
Estimates based on sources and methods described in "The Changing Wealth of Nations: Measuring Sustainable Development in the New Millennium" (World Bank, 2011).
Categories, topics:
Environment
Last updated:
apr 23, 2017
Indicators value changes by year
Meaning:
0.215
Minimum:
0.11
jan 1, 2011
Maximum:
0.397
jan 1, 2016
At the date of observation
Value
Absolute change
Change from the previous value
jan 1, 1996
0.276
+0.276
0.0%
jan 1, 1997
0.265
-0.011
-3.94%
jan 1, 1998
0.244
-0.02
-7.73%
jan 1, 1999
0.222
-0.022
-9.15%
jan 1, 2000
0.327
+0.105
47.1%
jan 1, 2001
0.268
-0.058
-17.83%
jan 1, 2002
0.187
-0.082
-30.38%
jan 1, 2003
0.203
+0.016
8.61%
jan 1, 2004
0.237
+0.034
16.62%
jan 1, 2005
0.189
-0.048
-20.38%
jan 1, 2006
0.156
-0.032
-17.21%
jan 1, 2007
0.172
+0.016
10.26%
jan 1, 2008
0.147
-0.025
-14.29%
jan 1, 2009
0.12
-0.027
-18.33%
jan 1, 2010
0.137
+0.016
13.52%
jan 1, 2011
0.11
-0.027
-19.8%
jan 1, 2012
0.123
+0.014
12.37%
jan 1, 2013
0.139
+0.016
12.91%
jan 1, 2014
0.285
+0.146
105.03%
jan 1, 2015
0.313
+0.028
9.7%
jan 1, 2016
0.397
+0.084
26.91%
Ranking of countries by current statistics by years