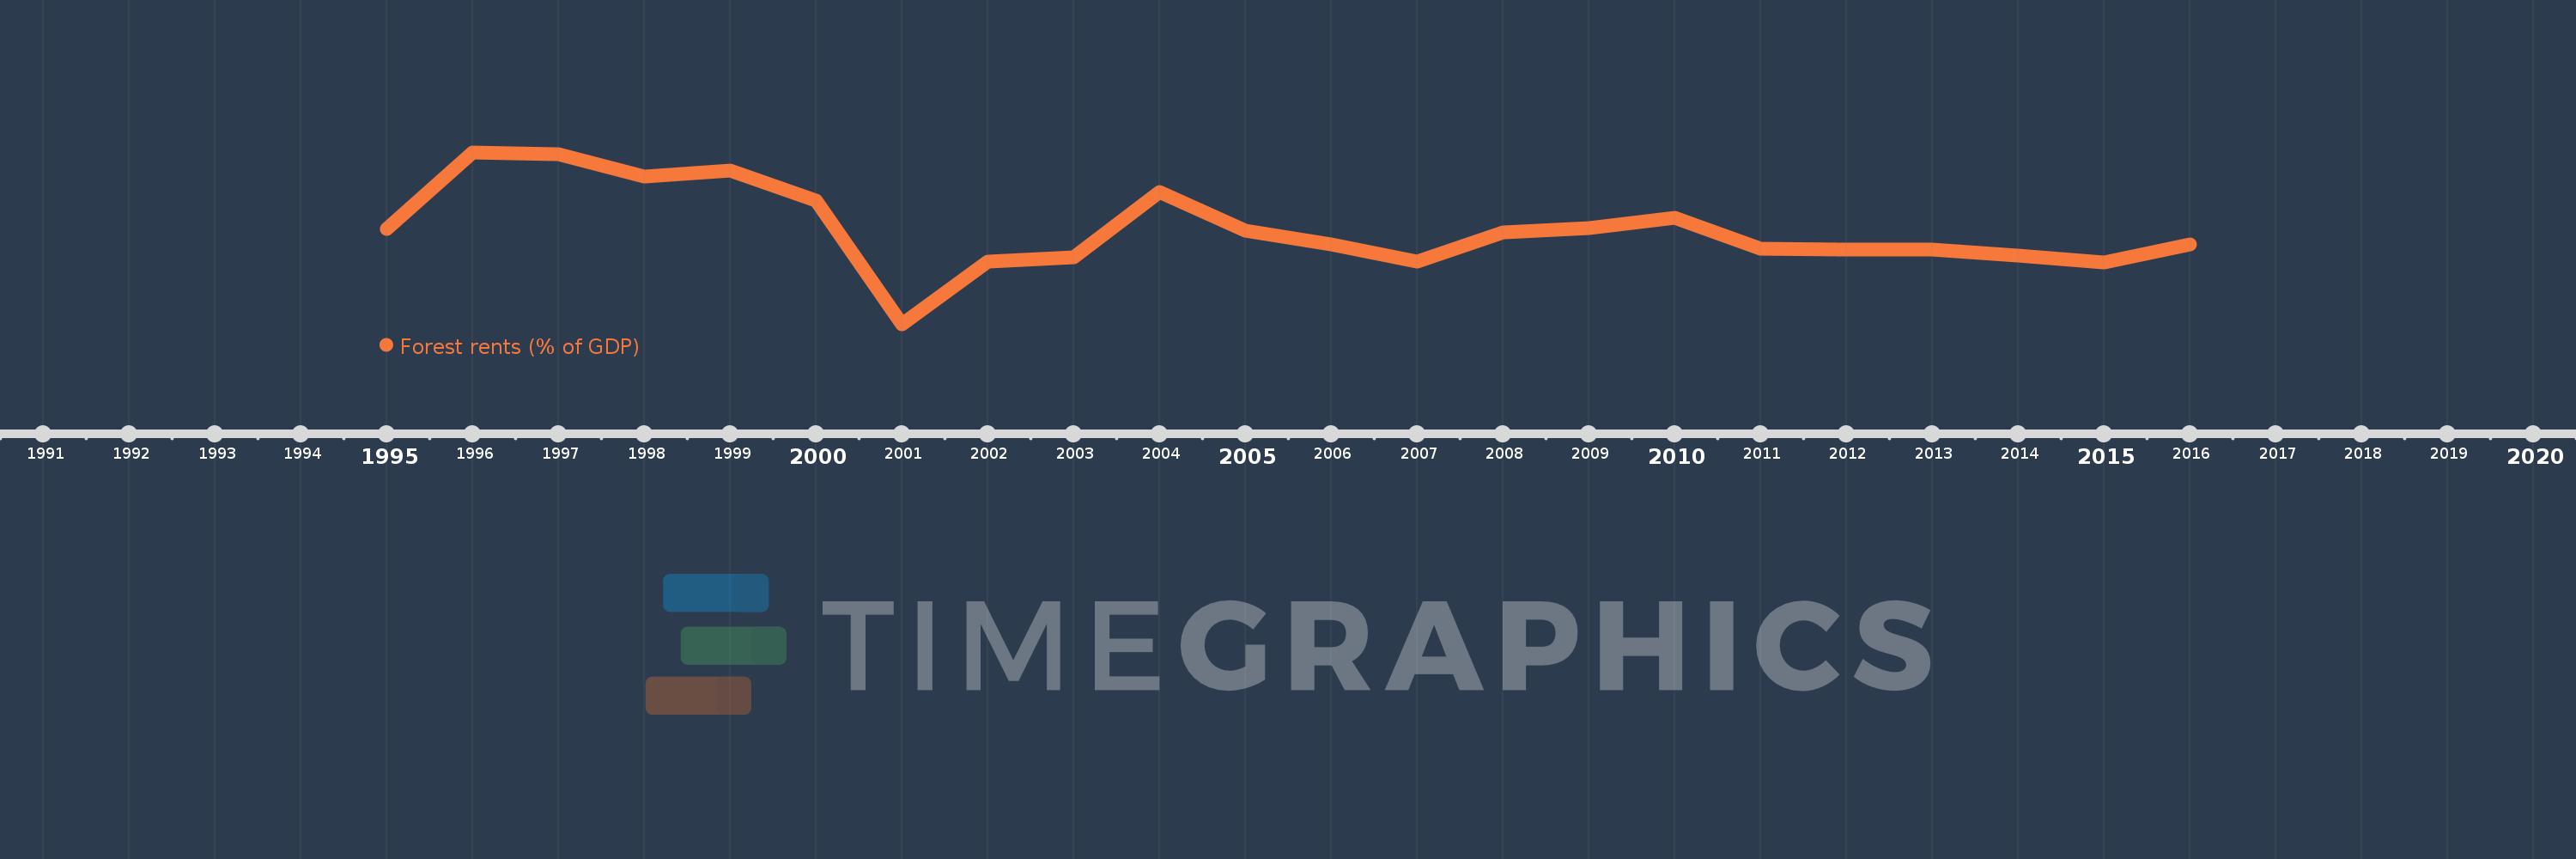
This timeline shows a graph from 1995 to 2016 of Congo, Dem. Rep.. No data until 1994. Number of actual observations by date: 22.
Source name:
World Development Indicators
Source organization:
Estimates based on sources and methods described in "The Changing Wealth of Nations: Measuring Sustainable Development in the New Millennium" (World Bank, 2011).
Categories, topics:
Environment
Last updated:
apr 23, 2017
Indicators value changes by year
Meaning:
21.768
Minimum:
6.569
jan 1, 2001
Maximum:
34.101
jan 1, 1996
At the date of observation
Value
Absolute change
Change from the previous value
jan 1, 1995
21.831
+21.831
0.0%
jan 1, 1996
34.101
+12.27
56.21%
jan 1, 1997
33.799
-0.302
-0.88%
jan 1, 1998
30.21
-3.59
-10.62%
jan 1, 1999
31.175
+0.966
3.2%
jan 1, 2000
26.399
-4.776
-15.32%
jan 1, 2001
6.569
-19.83
-75.12%
jan 1, 2002
16.538
+9.969
151.76%
jan 1, 2003
17.24
+0.702
4.25%
jan 1, 2004
27.754
+10.513
60.98%
jan 1, 2005
21.554
-6.2
-22.34%
jan 1, 2006
19.332
-2.222
-10.31%
jan 1, 2007
16.553
-2.779
-14.38%
jan 1, 2008
21.233
+4.68
28.27%
jan 1, 2009
21.917
+0.684
3.22%
jan 1, 2010
23.561
+1.644
7.5%
jan 1, 2011
18.639
-4.922
-20.89%
jan 1, 2012
18.463
-0.176
-0.94%
jan 1, 2013
18.573
+0.11
0.6%
jan 1, 2014
17.622
-0.951
-5.12%
jan 1, 2015
16.517
-1.106
-6.28%
jan 1, 2016
19.322
+2.805
16.99%
Ranking of countries by current statistics by years