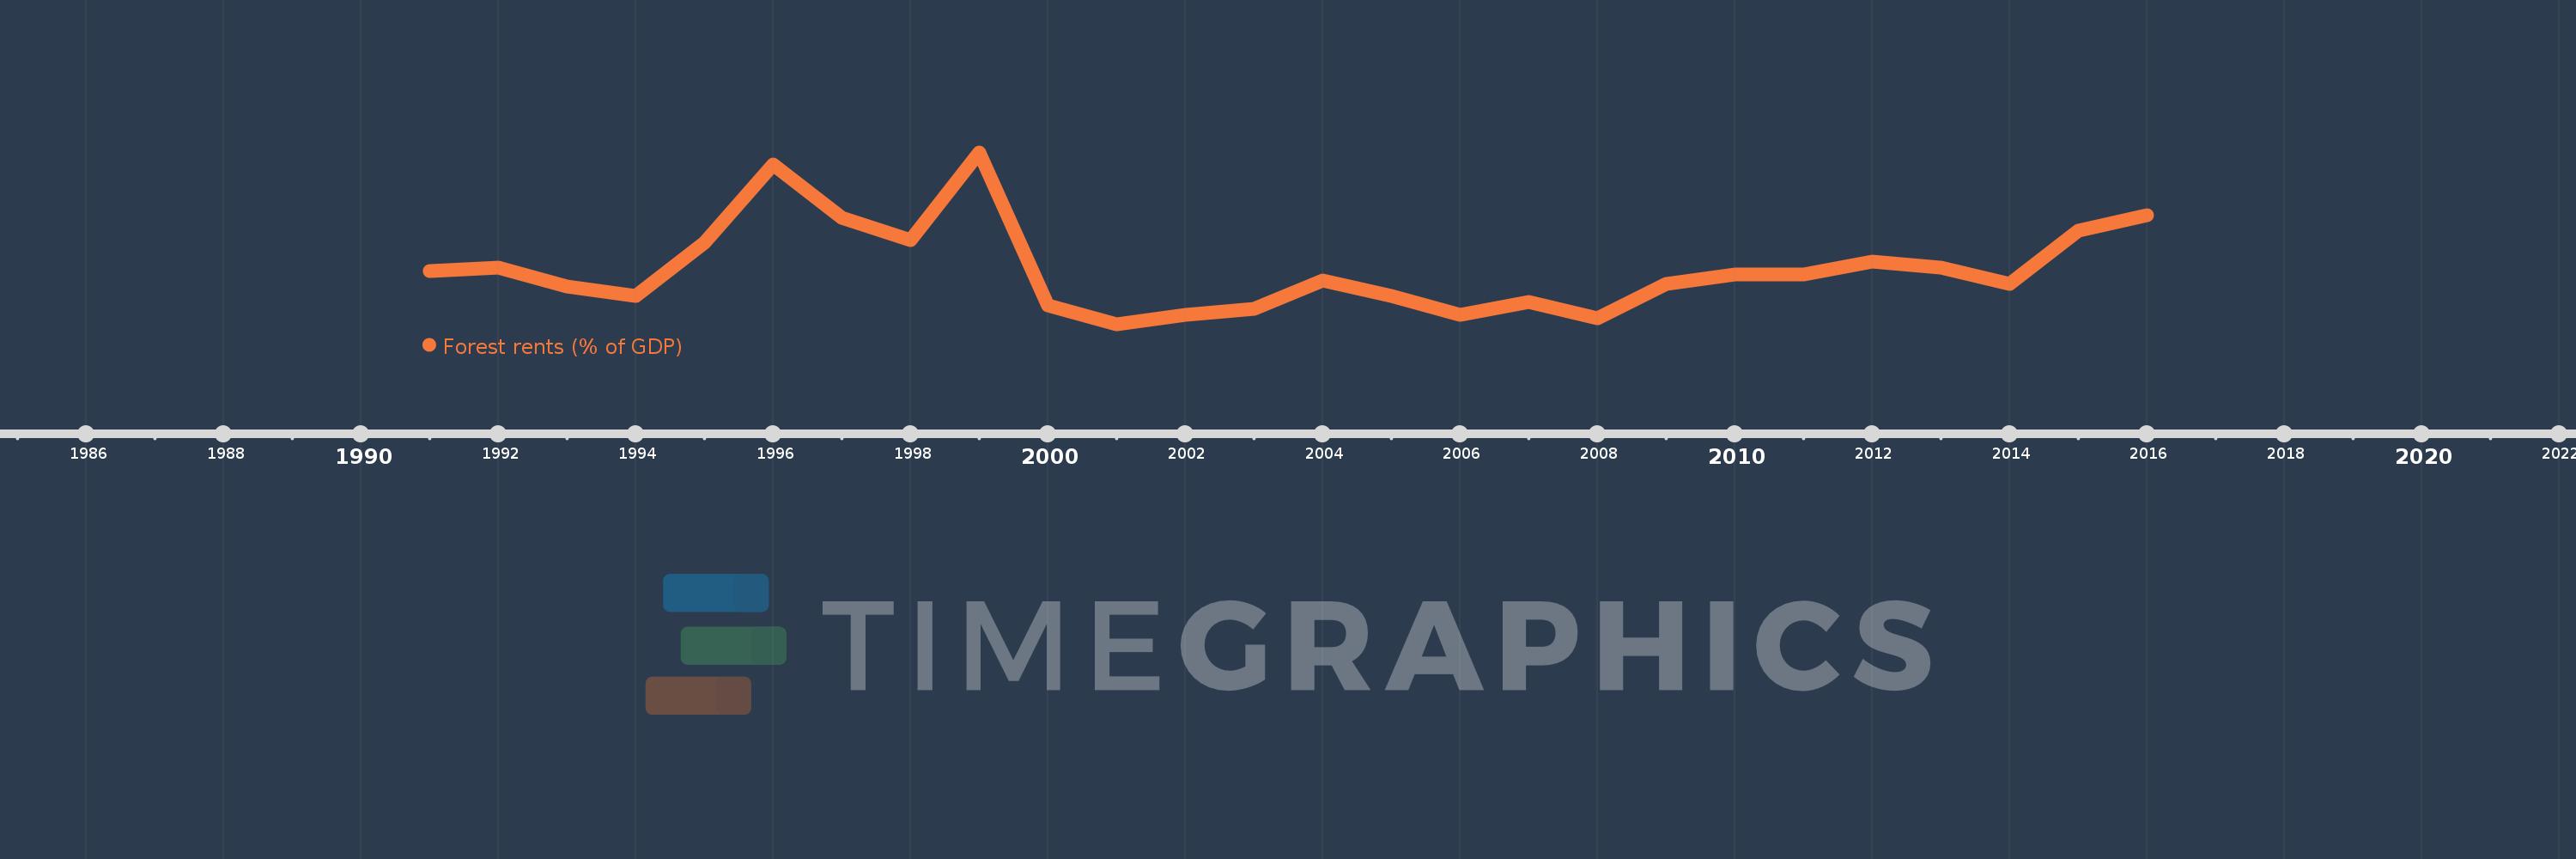
This timeline shows a graph from 1991 to 2016 of Yemen, Rep.. No data until 1990. Number of actual observations by date: 26.
Source name:
World Development Indicators
Source organization:
Estimates based on sources and methods described in "The Changing Wealth of Nations: Measuring Sustainable Development in the New Millennium" (World Bank, 2011).
Categories, topics:
Environment
Last updated:
apr 23, 2017
Indicators value changes by year
Meaning:
0.04
Minimum:
0.022
jan 1, 2001
Maximum:
0.077
jan 1, 1999
At the date of observation
Value
Absolute change
Change from the previous value
jan 1, 1991
0.039
+0.039
0.0%
jan 1, 1992
0.04
+0.001
2.98%
jan 1, 1993
0.034
-0.006
-15.83%
jan 1, 1994
0.031
-0.003
-8.2%
jan 1, 1995
0.048
+0.017
54.86%
jan 1, 1996
0.073
+0.025
52.89%
jan 1, 1997
0.056
-0.017
-23.2%
jan 1, 1998
0.049
-0.007
-12.05%
jan 1, 1999
0.077
+0.028
56.61%
jan 1, 2000
0.028
-0.049
-63.54%
jan 1, 2001
0.022
-0.006
-20.38%
jan 1, 2002
0.025
+0.003
12.61%
jan 1, 2003
0.027
+0.001
5.87%
jan 1, 2004
0.036
+0.009
33.51%
jan 1, 2005
0.031
-0.005
-14.79%
jan 1, 2006
0.025
-0.005
-17.1%
jan 1, 2007
0.029
+0.003
12.98%
jan 1, 2008
0.024
-0.005
-15.99%
jan 1, 2009
0.035
+0.011
45.9%
jan 1, 2010
0.038
+0.003
7.69%
jan 1, 2011
0.038
+0.0
0.49%
jan 1, 2012
0.042
+0.005
11.98%
jan 1, 2013
0.04
-0.003
-6.59%
jan 1, 2014
0.035
-0.005
-12.39%
jan 1, 2015
0.052
+0.018
50.93%
jan 1, 2016
0.057
+0.005
9.06%
Ranking of countries by current statistics by years