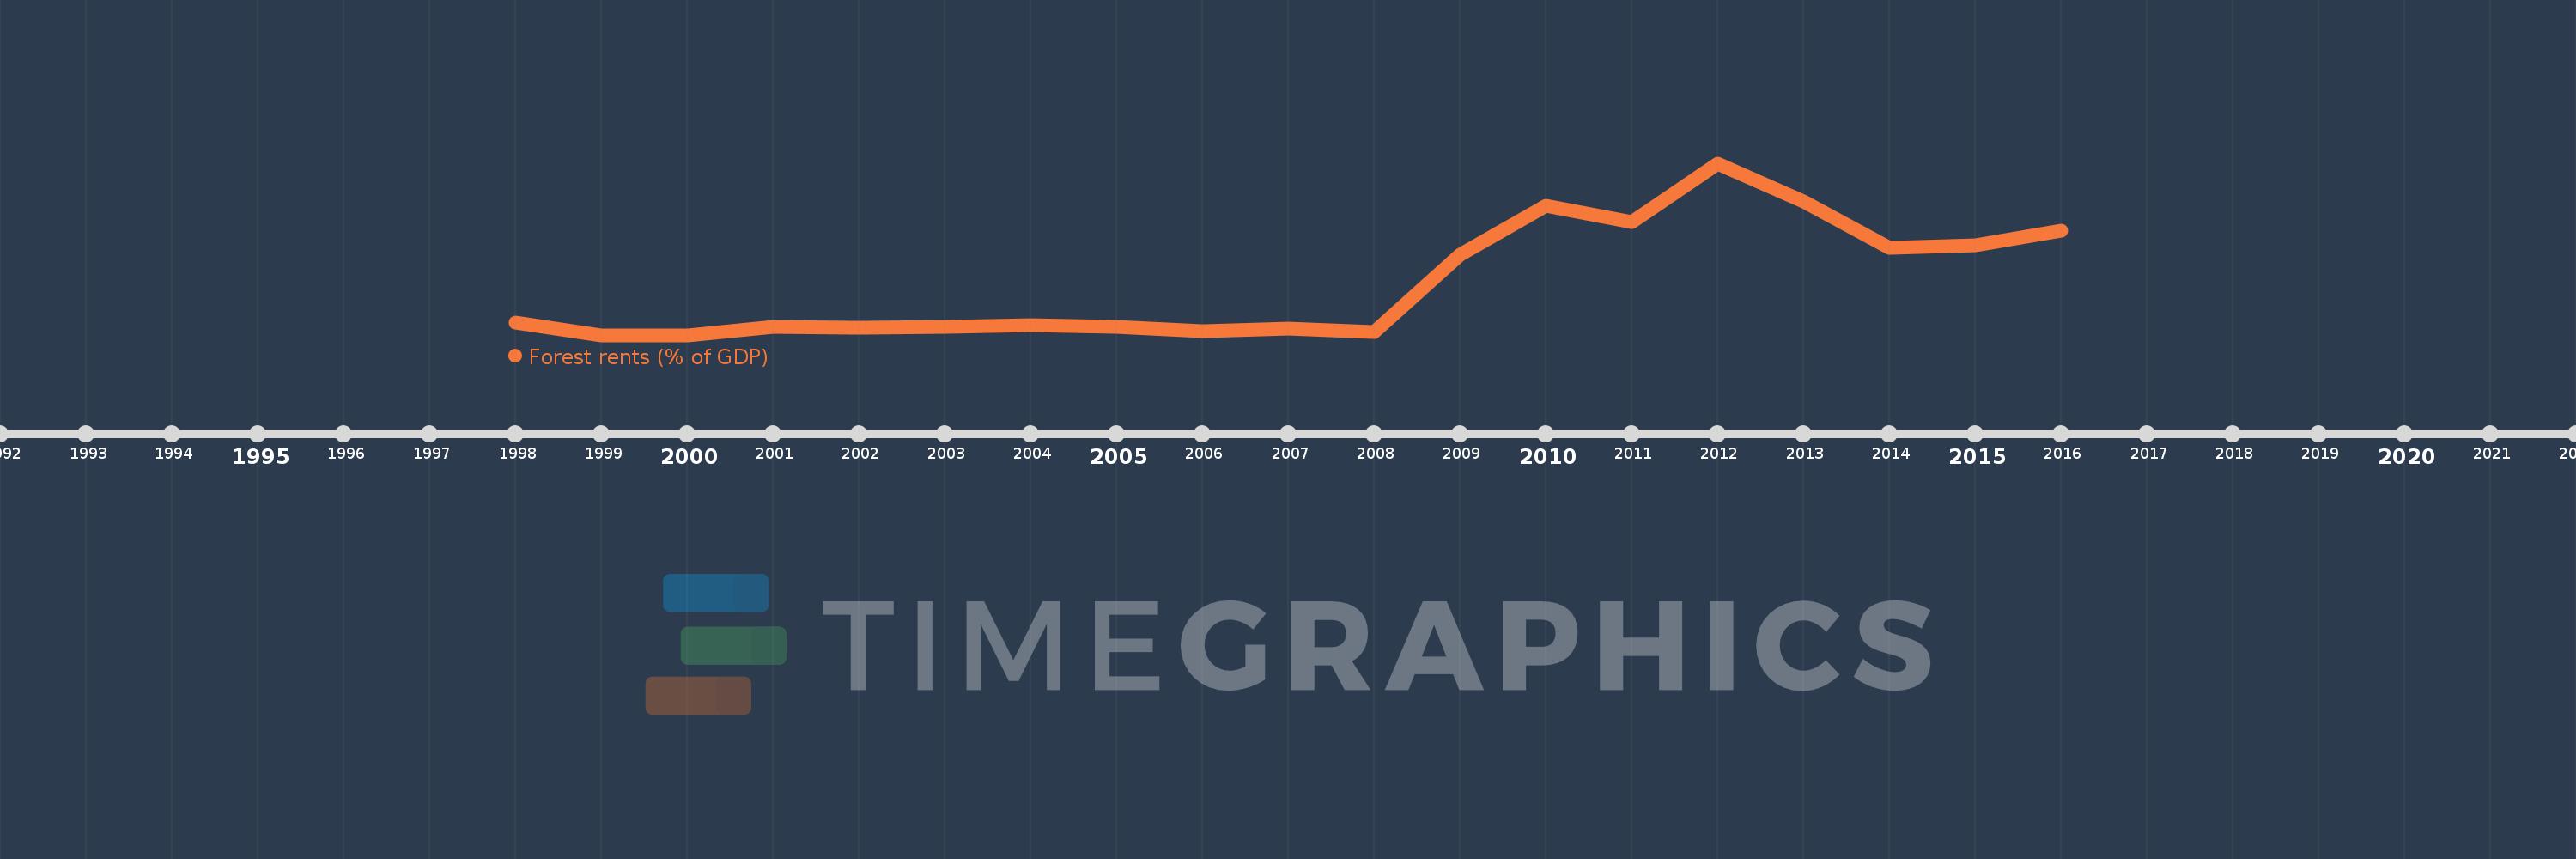
This timeline shows a graph from 1998 to 2016 of Armenia. No data until 1997. Number of actual observations by date: 19.
Source name:
World Development Indicators
Source organization:
Estimates based on sources and methods described in "The Changing Wealth of Nations: Measuring Sustainable Development in the New Millennium" (World Bank, 2011).
Categories, topics:
Environment
Last updated:
apr 23, 2017
Indicators value changes by year
Meaning:
0.136
Minimum:
0.0
jan 1, 1999
Maximum:
0.454
jan 1, 2012
At the date of observation
Value
Absolute change
Change from the previous value
jan 1, 1998
0.034
+0.034
0.0%
jan 1, 1999
0.0
-0.034
-100.0%
jan 1, 2000
0.0
0.0
%
jan 1, 2001
0.022
+0.022
%
jan 1, 2002
0.019
-0.003
-14.1%
jan 1, 2003
0.021
+0.002
8.21%
jan 1, 2004
0.027
+0.007
31.8%
jan 1, 2005
0.022
-0.005
-19.76%
jan 1, 2006
0.01
-0.011
-52.9%
jan 1, 2007
0.016
+0.006
54.45%
jan 1, 2008
0.009
-0.007
-41.18%
jan 1, 2009
0.213
+0.204
2.2K%
jan 1, 2010
0.341
+0.128
59.86%
jan 1, 2011
0.298
-0.043
-12.66%
jan 1, 2012
0.454
+0.156
52.2%
jan 1, 2013
0.353
-0.101
-22.19%
jan 1, 2014
0.23
-0.123
-34.87%
jan 1, 2015
0.238
+0.008
3.61%
jan 1, 2016
0.276
+0.038
15.98%
Ranking of countries by current statistics by years