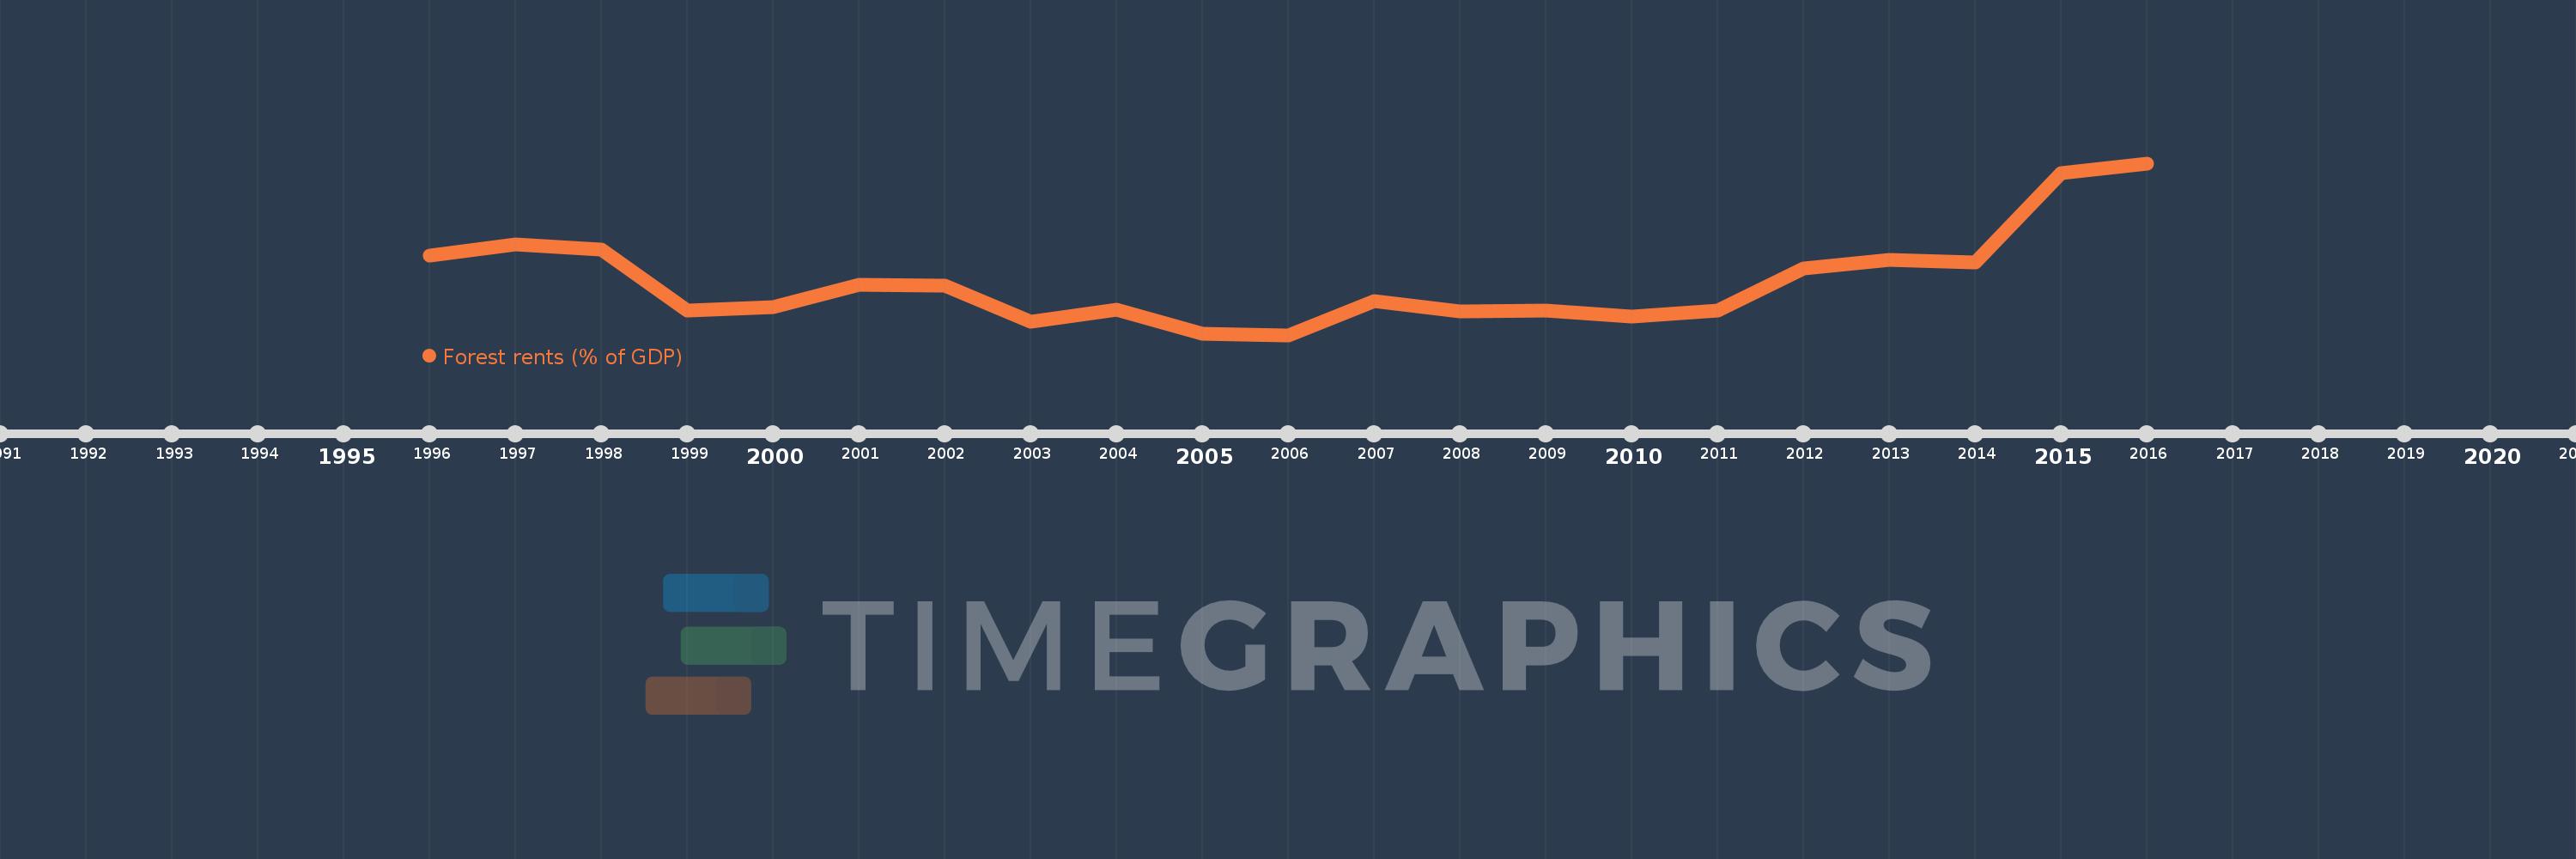
This timeline shows a graph from 1996 to 2016 of Slovenia. No data until 1995. Number of actual observations by date: 21.
Source name:
World Development Indicators
Source organization:
Estimates based on sources and methods described in "The Changing Wealth of Nations: Measuring Sustainable Development in the New Millennium" (World Bank, 2011).
Categories, topics:
Environment
Last updated:
apr 23, 2017
Indicators value changes by year
Meaning:
0.151
Minimum:
0.107
jan 1, 2006
Maximum:
0.247
jan 1, 2016
At the date of observation
Value
Absolute change
Change from the previous value
jan 1, 1996
0.172
+0.172
0.0%
jan 1, 1997
0.181
+0.009
5.06%
jan 1, 1998
0.177
-0.004
-2.21%
jan 1, 1999
0.127
-0.05
-27.99%
jan 1, 2000
0.13
+0.002
1.72%
jan 1, 2001
0.148
+0.019
14.31%
jan 1, 2002
0.147
-0.001
-0.89%
jan 1, 2003
0.118
-0.029
-19.47%
jan 1, 2004
0.128
+0.01
8.5%
jan 1, 2005
0.108
-0.021
-16.07%
jan 1, 2006
0.107
-0.001
-0.66%
jan 1, 2007
0.135
+0.028
25.94%
jan 1, 2008
0.126
-0.009
-6.82%
jan 1, 2009
0.127
+0.002
1.34%
jan 1, 2010
0.122
-0.005
-3.93%
jan 1, 2011
0.127
+0.005
4.07%
jan 1, 2012
0.161
+0.034
26.94%
jan 1, 2013
0.168
+0.007
4.24%
jan 1, 2014
0.166
-0.002
-1.3%
jan 1, 2015
0.239
+0.073
44.08%
jan 1, 2016
0.247
+0.008
3.38%
Ranking of countries by current statistics by years