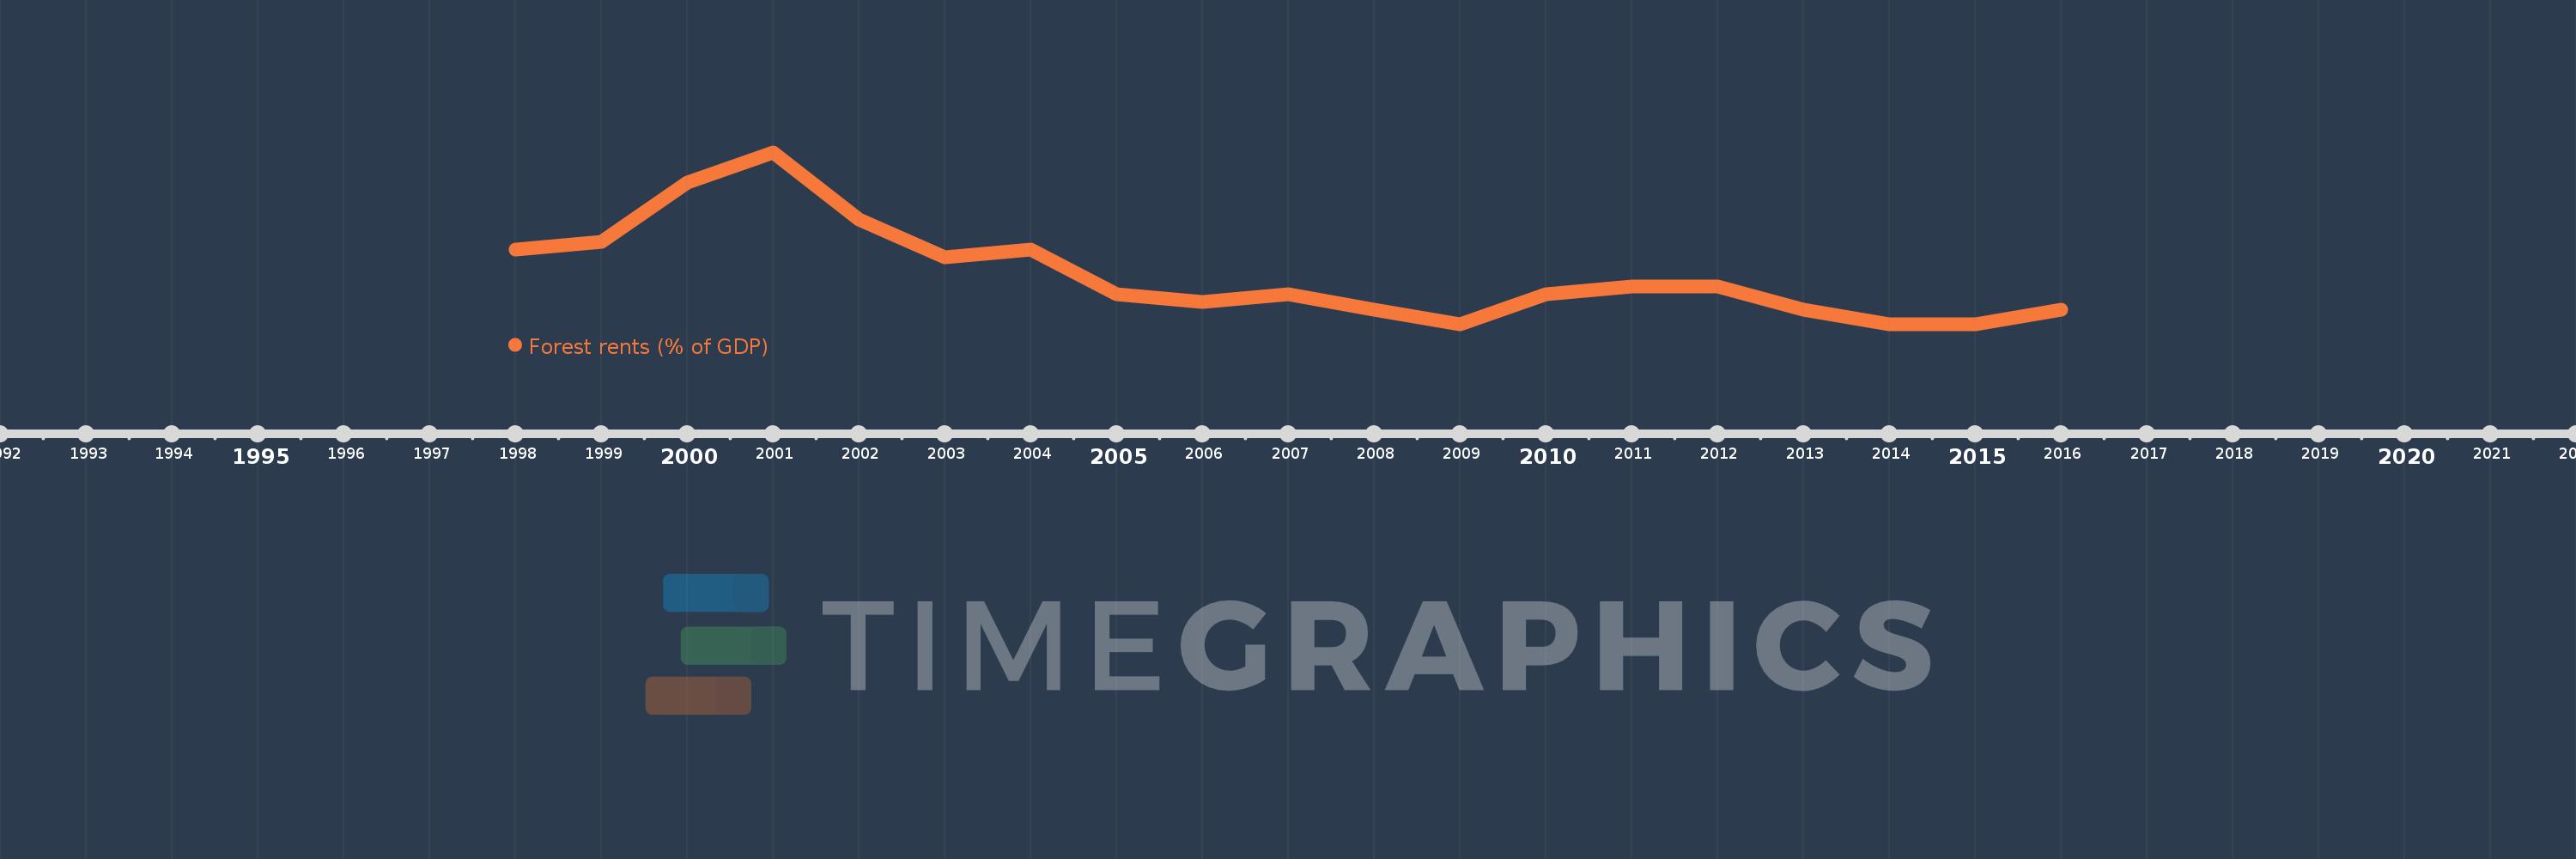
This timeline shows a graph from 1998 to 2016 of Kyrgyz Republic. No data until 1997. Number of actual observations by date: 19.
Source name:
World Development Indicators
Source organization:
Estimates based on sources and methods described in "The Changing Wealth of Nations: Measuring Sustainable Development in the New Millennium" (World Bank, 2011).
Categories, topics:
Environment
Last updated:
apr 23, 2017
Indicators value changes by year
Meaning:
0.02
Minimum:
0.013
jan 1, 2009
Maximum:
0.036
jan 1, 2001
At the date of observation
Value
Absolute change
Change from the previous value
jan 1, 1998
0.023
+0.023
0.0%
jan 1, 1999
0.024
+0.001
2.84%
jan 1, 2000
0.032
+0.008
33.47%
jan 1, 2001
0.036
+0.003
10.36%
jan 1, 2002
0.027
-0.009
-24.48%
jan 1, 2003
0.022
-0.005
-18.36%
jan 1, 2004
0.023
+0.002
7.35%
jan 1, 2005
0.017
-0.006
-26.15%
jan 1, 2006
0.016
-0.002
-10.25%
jan 1, 2007
0.017
+0.001
7.36%
jan 1, 2008
0.015
-0.002
-10.11%
jan 1, 2009
0.013
-0.002
-16.46%
jan 1, 2010
0.017
+0.005
39.02%
jan 1, 2011
0.018
+0.001
2.98%
jan 1, 2012
0.018
+0.0
2.6%
jan 1, 2013
0.015
-0.004
-19.3%
jan 1, 2014
0.013
-0.002
-14.2%
jan 1, 2015
0.013
+0.0
1.11%
jan 1, 2016
0.015
+0.002
12.62%
Ranking of countries by current statistics by years