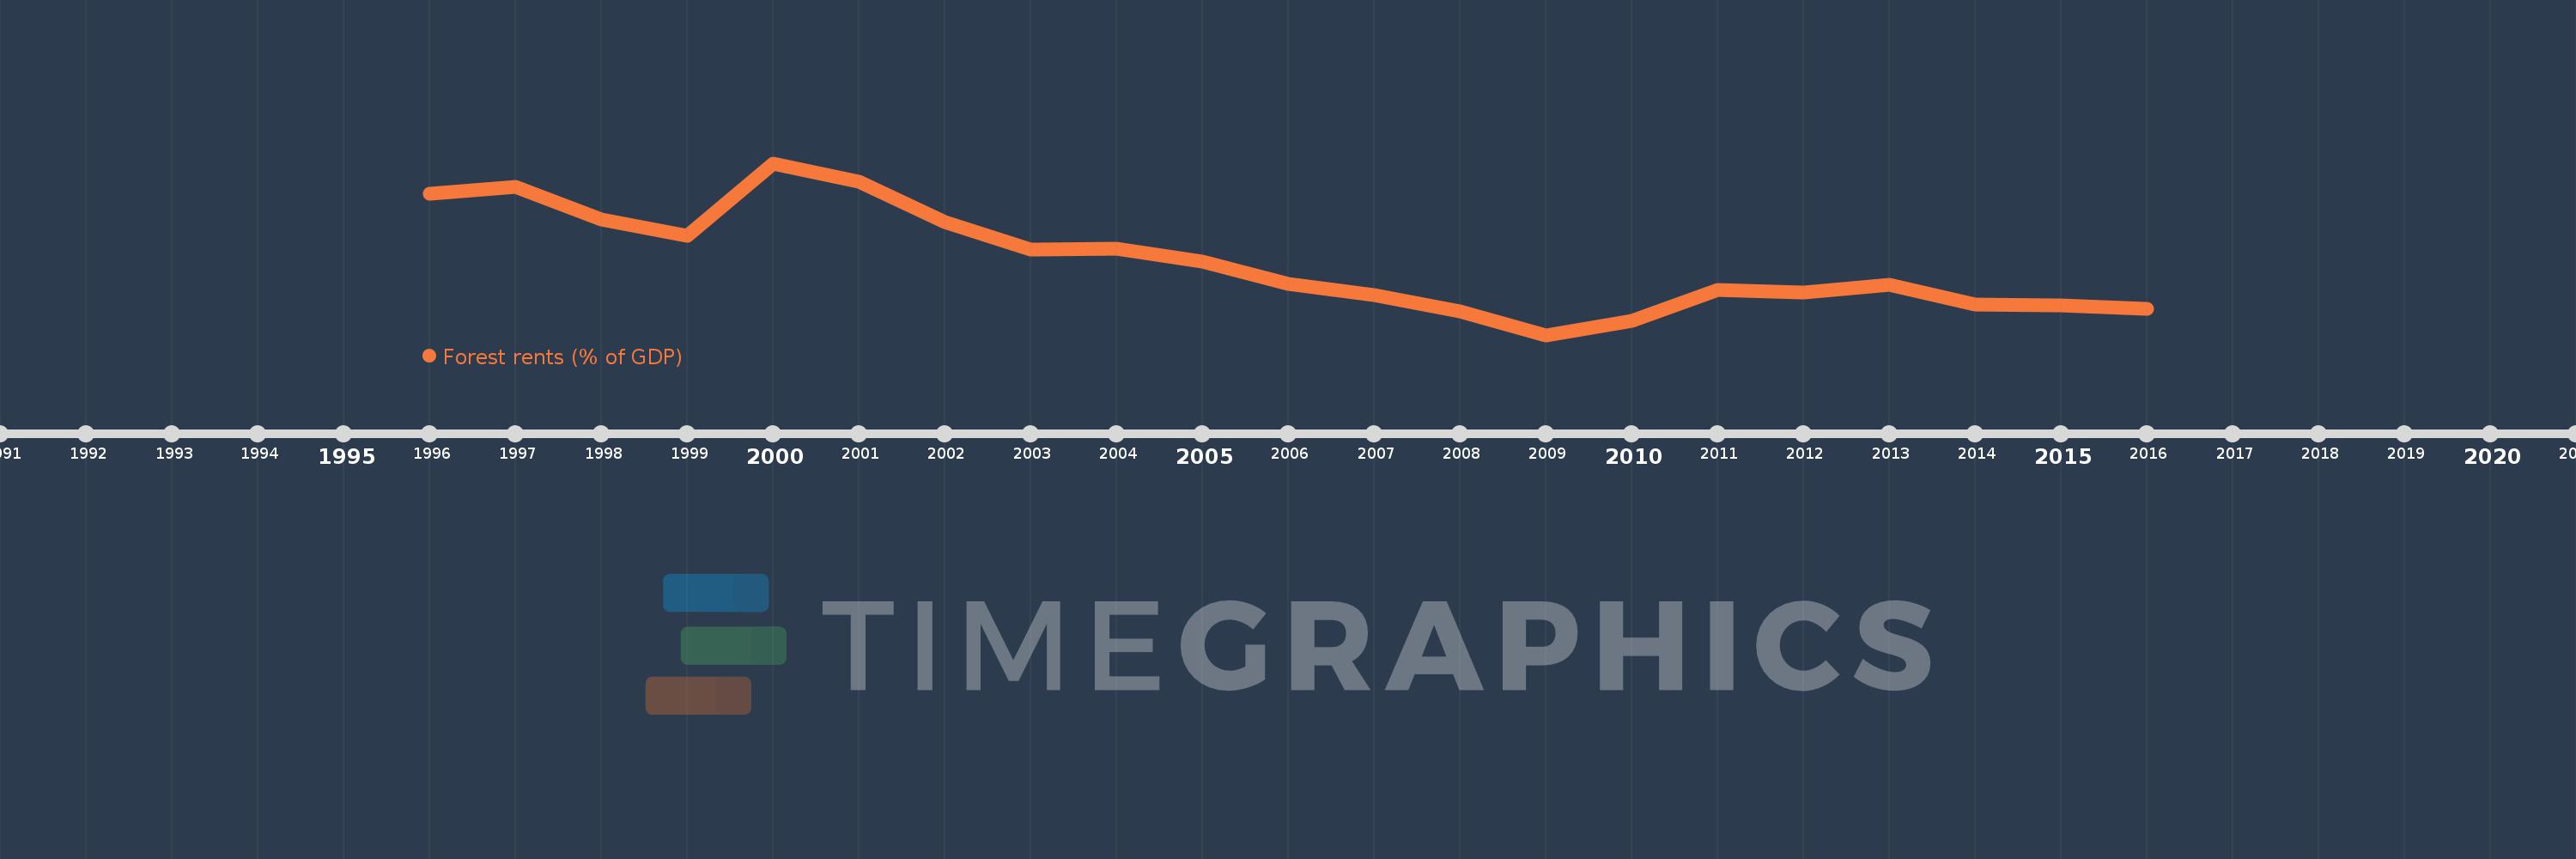
This timeline shows a graph from 1996 to 2016 of Latvia. No data until 1995. Number of actual observations by date: 21.
Source name:
World Development Indicators
Source organization:
Estimates based on sources and methods described in "The Changing Wealth of Nations: Measuring Sustainable Development in the New Millennium" (World Bank, 2011).
Categories, topics:
Environment
Last updated:
apr 23, 2017
Indicators value changes by year
Meaning:
1.588
Minimum:
0.662
jan 1, 2009
Maximum:
2.831
jan 1, 2000
At the date of observation
Value
Absolute change
Change from the previous value
jan 1, 1996
2.442
+2.442
0.0%
jan 1, 1997
2.538
+0.096
3.93%
jan 1, 1998
2.119
-0.419
-16.51%
jan 1, 1999
1.919
-0.2
-9.44%
jan 1, 2000
2.831
+0.912
47.5%
jan 1, 2001
2.599
-0.231
-8.18%
jan 1, 2002
2.084
-0.515
-19.83%
jan 1, 2003
1.742
-0.342
-16.41%
jan 1, 2004
1.75
+0.008
0.45%
jan 1, 2005
1.586
-0.164
-9.37%
jan 1, 2006
1.308
-0.278
-17.53%
jan 1, 2007
1.168
-0.14
-10.7%
jan 1, 2008
0.958
-0.21
-17.98%
jan 1, 2009
0.662
-0.296
-30.9%
jan 1, 2010
0.846
+0.184
27.87%
jan 1, 2011
1.229
+0.383
45.25%
jan 1, 2012
1.195
-0.034
-2.8%
jan 1, 2013
1.298
+0.103
8.61%
jan 1, 2014
1.05
-0.248
-19.08%
jan 1, 2015
1.041
-0.009
-0.89%
jan 1, 2016
0.989
-0.051
-4.93%
Ranking of countries by current statistics by years