33
/
AIzaSyAYiBZKx7MnpbEhh9jyipgxe19OcubqV5w
May 1, 2025
196642
Micronesia, Fed. Sts.
FSM
true
2
1
Forest rents (% of GDP)
2016,2015,2014,2013,2012,2011,2010,2009,2008,2007,2006,2005,2004,2003,2002,2001,2000,1999,1998,1997,1996,1995,1994,1993,1992
Download
Global statistics library →Micronesia, Fed. Sts. →

Forest rents (% of GDP)

This statistics in other country:

AfghanistanAlbaniaAlgeriaAndorraAngolaArab WorldArgentinaArmeniaArubaAustraliaAustriaAzerbaijanBahamas, TheBahrainBangladeshBarbadosBelarusBelgiumBelizeBeninBhutanBoliviaBosnia and HerzegovinaBotswanaBrazilBrunei DarussalamBulgariaBurkina FasoBurundiCabo VerdeCambodiaCameroonCanadaCaribbean small statesCentral African RepublicCentral Europe and the BalticsChadChileChinaColombiaComorosCongo, Dem. Rep.Congo, Rep.Costa RicaCote d'IvoireCroatiaCubaCyprusCzech RepublicDenmarkDjiboutiDominicaDominican RepublicEarly-demographic dividendEast Asia & PacificEast Asia & Pacific (excluding high income)East Asia & Pacific (IDA & IBRD countries)EcuadorEgypt, Arab Rep.El SalvadorEquatorial GuineaEritreaEstoniaEthiopiaEuro areaEurope & Central AsiaEurope & Central Asia (excluding high income)Europe & Central Asia (IDA & IBRD countries)European UnionFaroe IslandsFijiFinlandFragile and conflict affected situationsFranceFrench PolynesiaGabonGambia, TheGeorgiaGermanyGhanaGreeceGuatemalaGuineaGuinea-BissauGuyanaHaitiHeavily indebted poor countries (HIPC)High incomeHondurasHong Kong SAR, ChinaHungaryIBRD onlyIcelandIDA & IBRD totalIDA blendIDA onlyIDA totalIndiaIndonesiaIran, Islamic Rep.IraqIrelandIsraelItalyJamaicaJapanJordanKazakhstanKenyaKiribatiKorea, Rep.KuwaitKyrgyz RepublicLao PDRLate-demographic dividendLatin America & Caribbean Latin America & Caribbean (excluding high income)Latin America & the Caribbean (IDA & IBRD countries)LatviaLeast developed countries: UN classificationLebanonLesothoLiberiaLibyaLiechtensteinLithuaniaLow & middle incomeLow incomeLower middle incomeLuxembourgMacao SAR, ChinaMacedonia, FYRMadagascarMalawiMalaysiaMaldivesMaliMaltaMauritaniaMauritiusMexicoMicronesia, Fed. Sts.Middle East & North AfricaMiddle East & North Africa (excluding high income)Middle East & North Africa (IDA & IBRD countries)Middle incomeMoldovaMongoliaMontenegroMoroccoMozambiqueMyanmarNamibiaNepalNetherlandsNew CaledoniaNew ZealandNicaraguaNigerNigeriaNorth AmericaNorwayOECD membersOmanOther small statesPacific island small statesPakistanPanamaPapua New GuineaParaguayPeruPhilippinesPolandPortugalPost-demographic dividendPre-demographic dividendQatarRomaniaRussian FederationRwandaSamoaSao Tome and PrincipeSaudi ArabiaSenegalSerbiaSeychellesSierra LeoneSingaporeSlovak RepublicSloveniaSmall statesSolomon IslandsSomaliaSouth AfricaSouth AsiaSouth Asia (IDA & IBRD)South SudanSpainSri LankaSt. LuciaSt. Vincent and the GrenadinesSub-Saharan Africa Sub-Saharan Africa (excluding high income)Sub-Saharan Africa (IDA & IBRD countries)SudanSurinameSwazilandSwedenSwitzerlandSyrian Arab RepublicTajikistanTanzaniaThailandTimor-LesteTogoTongaTrinidad and TobagoTunisiaTurkeyTurkmenistanUgandaUkraineUnited Arab EmiratesUnited KingdomUnited StatesUpper middle incomeUruguayUzbekistanVanuatuVenezuela, RBVietnamWorldYemen, Rep.ZambiaZimbabwe

Timeline:

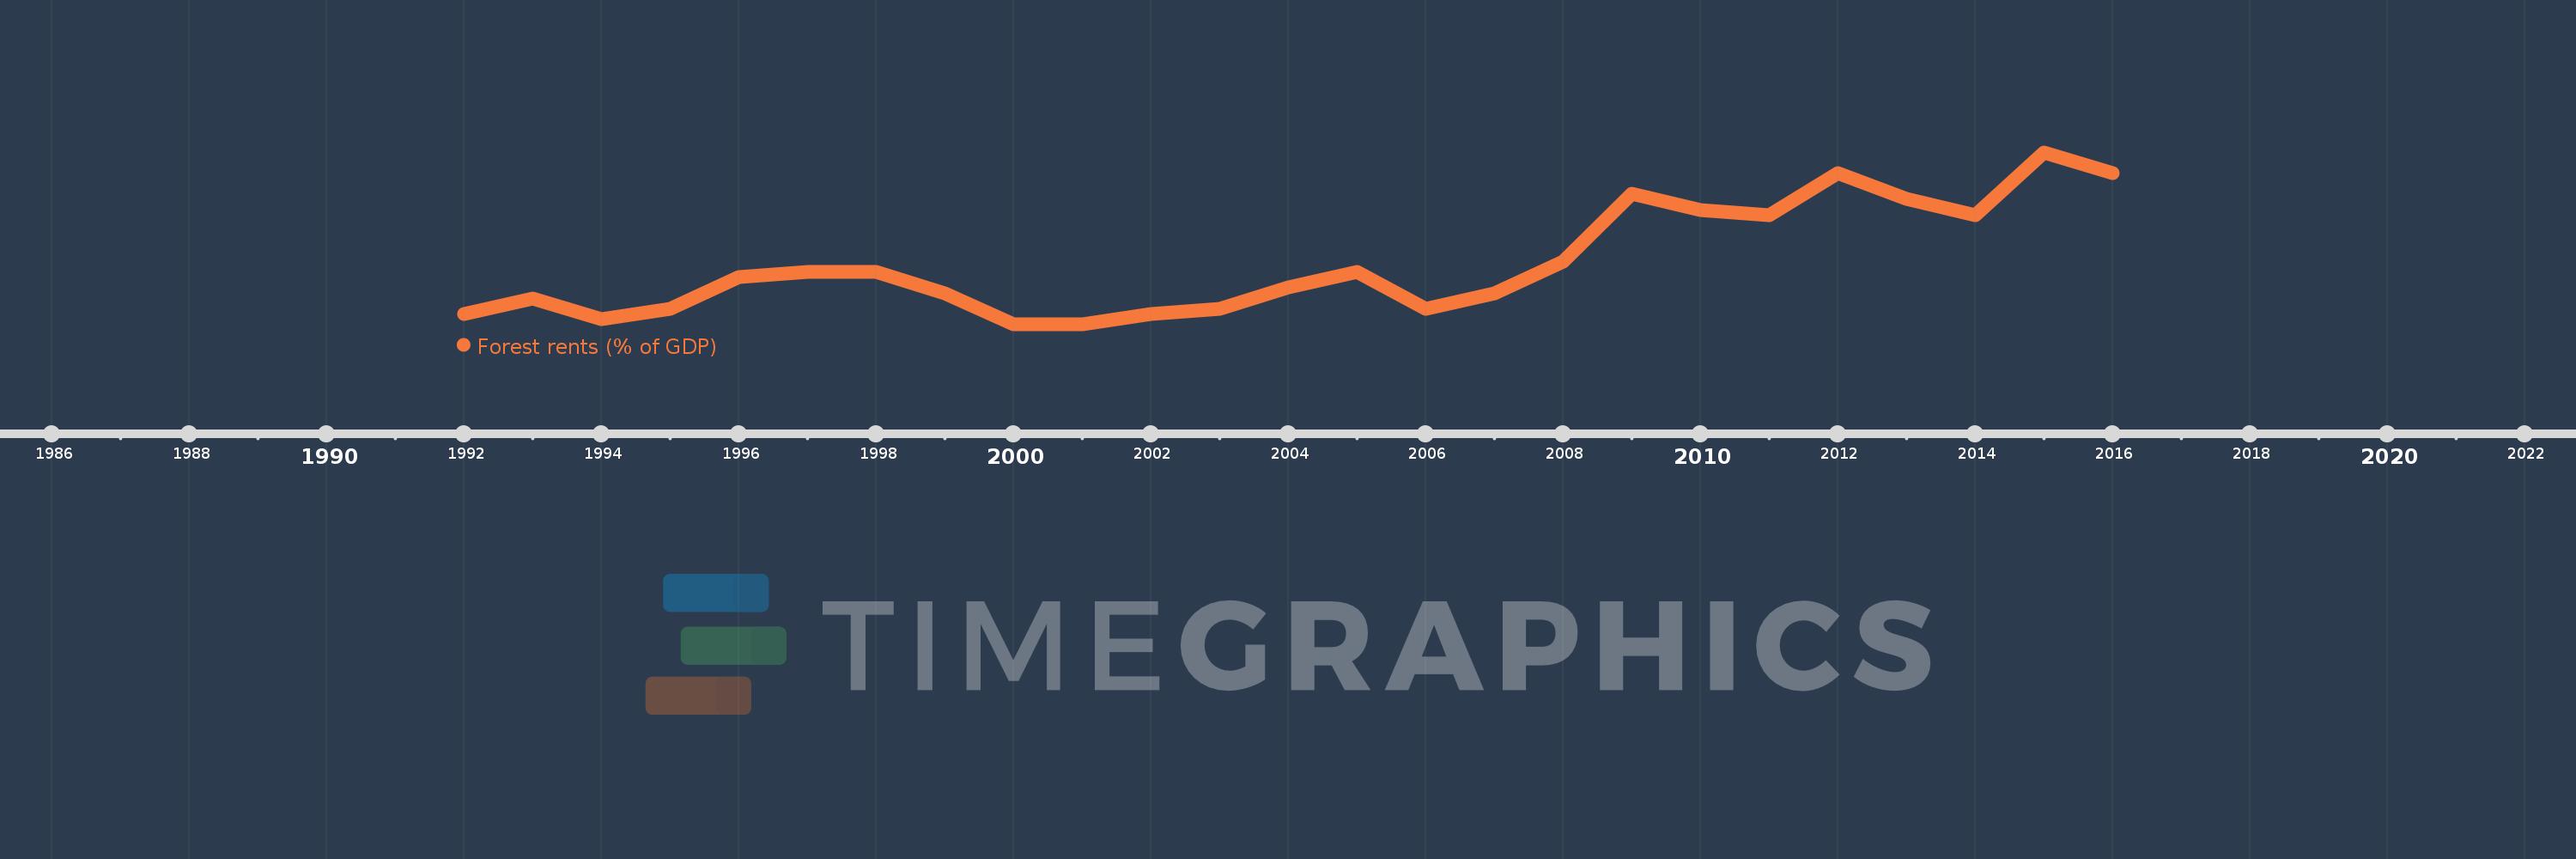
This timeline shows a graph from 1992 to 2016 of Micronesia, Fed. Sts.. No data until 1991. Number of actual observations by date: 25.

Source name:

World Development Indicators

Source organization:

Estimates based on sources and methods described in "The Changing Wealth of Nations: Measuring Sustainable Development in the New Millennium" (World Bank, 2011).

Categories, topics:

Environment

Last updated:

apr 23, 2017

Indicators value changes by year

Meaning:
0.019
Minimum:
0.007
jan 1, 2000
Maximum:
0.04
jan 1, 2015
At the date of observation
Value
Absolute change
Change from the previous value
jan 1, 1992
0.009
+0.009
0.0%
jan 1, 1993
0.012
+0.003
30.73%
jan 1, 1994
0.008
-0.004
-36.17%
jan 1, 1995
0.01
+0.003
34.14%
jan 1, 1996
0.016
+0.006
54.77%
jan 1, 1997
0.017
+0.001
7.89%
jan 1, 1998
0.017
0.0
-1.72%
jan 1, 1999
0.013
-0.004
-23.06%
jan 1, 2000
0.007
-0.006
-45.49%
jan 1, 2001
0.007
+0.0
5.81%
jan 1, 2002
0.009
+0.001
15.25%
jan 1, 2003
0.01
+0.001
13.58%
jan 1, 2004
0.014
+0.005
46.32%
jan 1, 2005
0.017
+0.002
15.86%
jan 1, 2006
0.01
-0.006
-38.71%
jan 1, 2007
0.013
+0.002
23.25%
jan 1, 2008
0.019
+0.006
51.63%
jan 1, 2009
0.032
+0.013
69.77%
jan 1, 2010
0.029
-0.003
-9.36%
jan 1, 2011
0.028
-0.002
-5.7%
jan 1, 2012
0.036
+0.008
29.07%
jan 1, 2013
0.031
-0.005
-14.05%
jan 1, 2014
0.028
-0.003
-8.21%
jan 1, 2015
0.04
+0.012
41.8%
jan 1, 2016
0.036
-0.003
-8.72%

Ranking of countries by current statistics by years