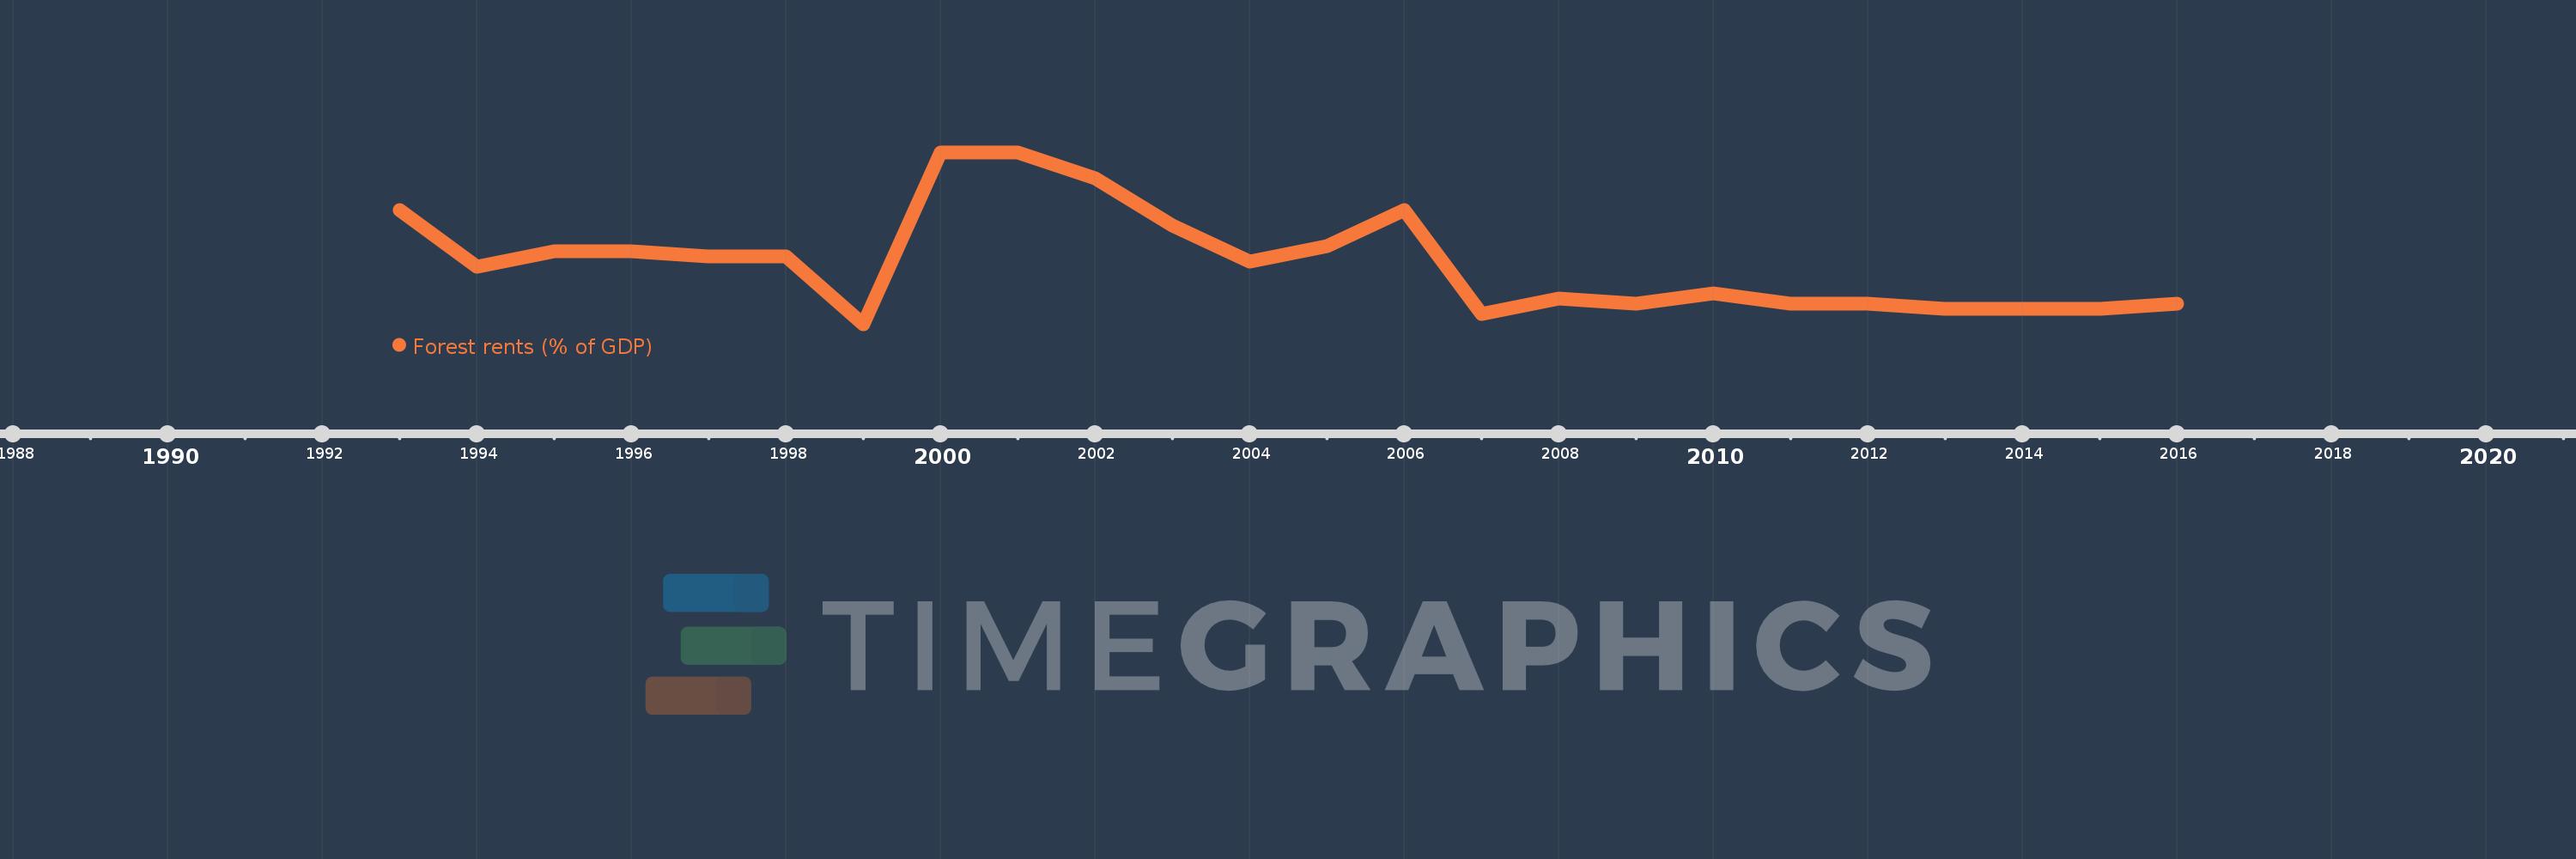
This timeline shows a graph from 1993 to 2016 of Kazakhstan. No data until 1992. Number of actual observations by date: 24.
Source name:
World Development Indicators
Source organization:
Estimates based on sources and methods described in "The Changing Wealth of Nations: Measuring Sustainable Development in the New Millennium" (World Bank, 2011).
Categories, topics:
Environment
Last updated:
apr 23, 2017
Indicators value changes by year
Meaning:
0.012
Minimum:
0.0
jan 1, 1999
Maximum:
0.033
jan 1, 2000
At the date of observation
Value
Absolute change
Change from the previous value
jan 1, 1993
0.022
+0.022
0.0%
jan 1, 1994
0.011
-0.011
-51.34%
jan 1, 1995
0.014
+0.003
28.83%
jan 1, 1996
0.014
+0.0
0.28%
jan 1, 1997
0.013
-0.001
-5.13%
jan 1, 1998
0.013
-0.001
-3.82%
jan 1, 1999
0.0
-0.013
-100.0%
jan 1, 2000
0.033
+0.033
%
jan 1, 2001
0.033
0.0
-0.07%
jan 1, 2002
0.028
-0.004
-12.84%
jan 1, 2003
0.019
-0.01
-33.83%
jan 1, 2004
0.012
-0.007
-37.56%
jan 1, 2005
0.015
+0.003
27.49%
jan 1, 2006
0.022
+0.007
50.16%
jan 1, 2007
0.002
-0.02
-90.06%
jan 1, 2008
0.005
+0.003
118.97%
jan 1, 2009
0.004
-0.001
-10.59%
jan 1, 2010
0.006
+0.001
28.29%
jan 1, 2011
0.004
-0.002
-27.13%
jan 1, 2012
0.004
+0.0
1.22%
jan 1, 2013
0.003
-0.001
-32.28%
jan 1, 2014
0.003
+0.0
9.9%
jan 1, 2015
0.003
+0.0
8.62%
jan 1, 2016
0.004
+0.001
16.77%
Ranking of countries by current statistics by years