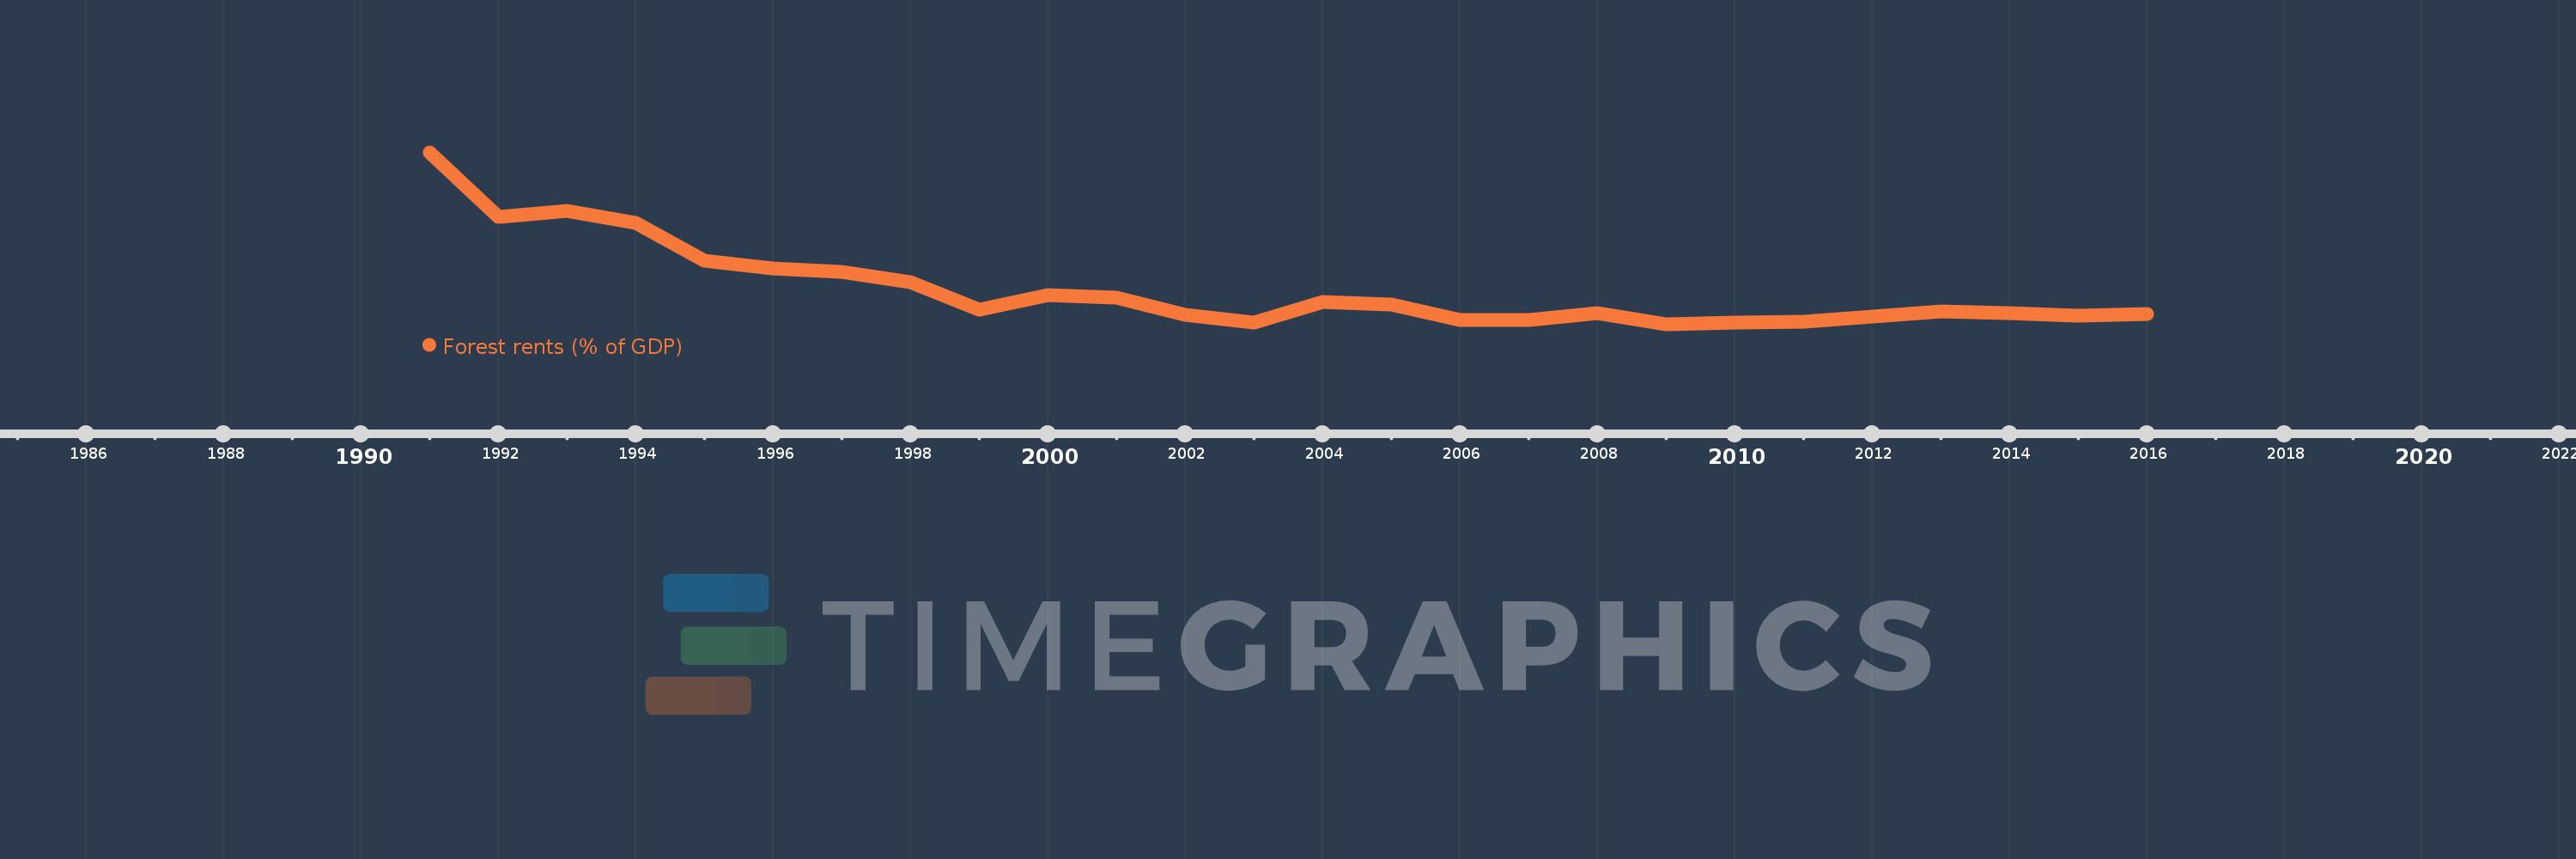
This timeline shows a graph from 1991 to 2016 of Poland. No data until 1990. Number of actual observations by date: 26.
Source name:
World Development Indicators
Source organization:
Estimates based on sources and methods described in "The Changing Wealth of Nations: Measuring Sustainable Development in the New Millennium" (World Bank, 2011).
Categories, topics:
Environment
Last updated:
apr 23, 2017
Indicators value changes by year
Meaning:
0.233
Minimum:
0.163
jan 1, 2009
Maximum:
0.508
jan 1, 1991
At the date of observation
Value
Absolute change
Change from the previous value
jan 1, 1991
0.508
+0.508
0.0%
jan 1, 1992
0.379
-0.128
-25.29%
jan 1, 1993
0.391
+0.012
3.17%
jan 1, 1994
0.367
-0.024
-6.1%
jan 1, 1995
0.291
-0.076
-20.73%
jan 1, 1996
0.275
-0.017
-5.7%
jan 1, 1997
0.268
-0.007
-2.5%
jan 1, 1998
0.247
-0.021
-7.86%
jan 1, 1999
0.193
-0.054
-21.98%
jan 1, 2000
0.222
+0.029
15.13%
jan 1, 2001
0.216
-0.006
-2.48%
jan 1, 2002
0.182
-0.034
-15.71%
jan 1, 2003
0.166
-0.016
-8.91%
jan 1, 2004
0.207
+0.041
24.65%
jan 1, 2005
0.203
-0.004
-1.84%
jan 1, 2006
0.171
-0.032
-15.75%
jan 1, 2007
0.171
+0.0
0.07%
jan 1, 2008
0.186
+0.015
8.76%
jan 1, 2009
0.163
-0.023
-12.41%
jan 1, 2010
0.167
+0.004
2.42%
jan 1, 2011
0.168
+0.001
0.44%
jan 1, 2012
0.178
+0.01
6.23%
jan 1, 2013
0.188
+0.01
5.41%
jan 1, 2014
0.186
-0.002
-1.17%
jan 1, 2015
0.18
-0.005
-2.85%
jan 1, 2016
0.183
+0.003
1.66%
Ranking of countries by current statistics by years