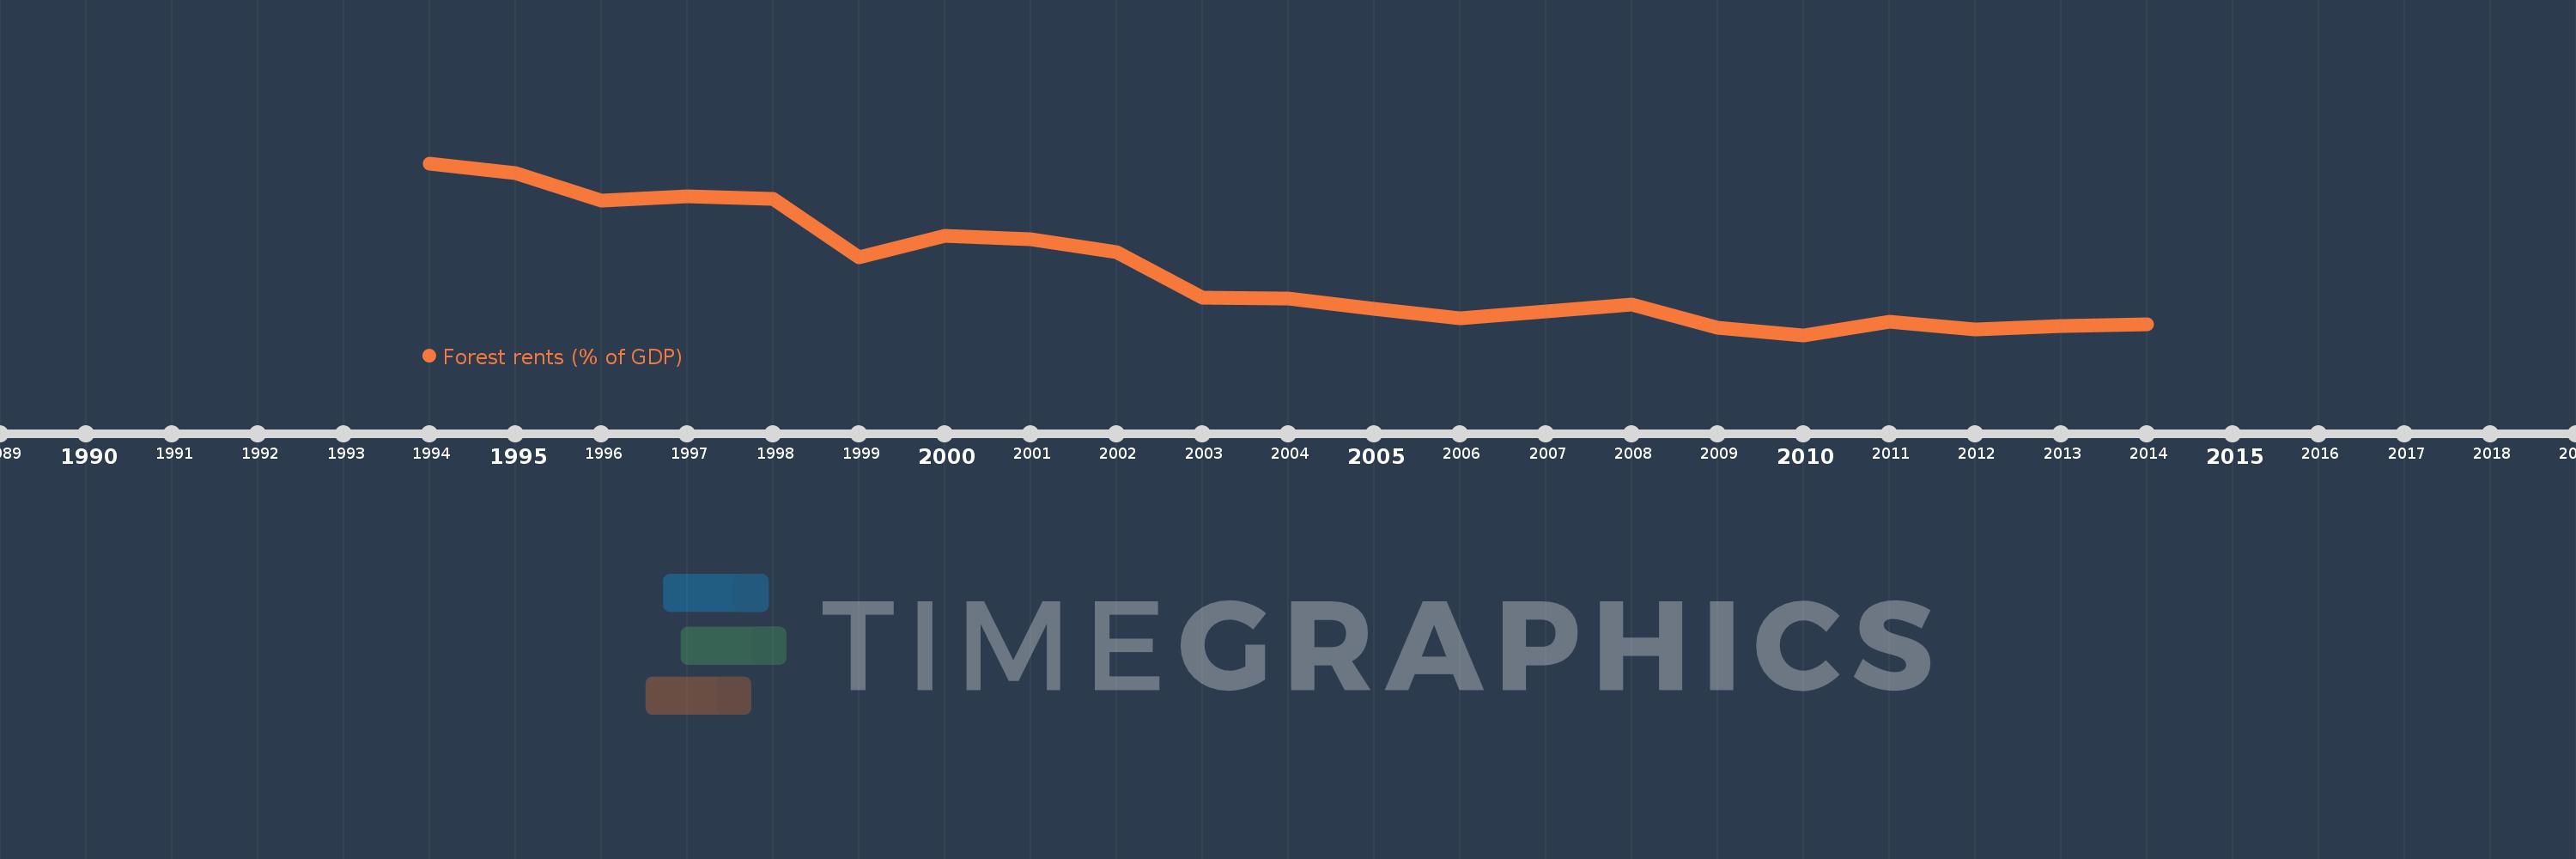
This timeline shows a graph from 1994 to 2014 of Czech Republic. No data until 1993. Number of actual observations by date: 21.
Source name:
World Development Indicators
Source organization:
Estimates based on sources and methods described in "The Changing Wealth of Nations: Measuring Sustainable Development in the New Millennium" (World Bank, 2011).
Categories, topics:
Environment
Last updated:
apr 23, 2017
Indicators value changes by year
Meaning:
0.253
Minimum:
0.145
jan 1, 2010
Maximum:
0.442
jan 1, 1994
At the date of observation
Value
Absolute change
Change from the previous value
jan 1, 1994
0.442
+0.442
0.0%
jan 1, 1995
0.425
-0.017
-3.85%
jan 1, 1996
0.377
-0.048
-11.2%
jan 1, 1997
0.385
+0.008
2.03%
jan 1, 1998
0.38
-0.005
-1.29%
jan 1, 1999
0.279
-0.101
-26.57%
jan 1, 2000
0.316
+0.037
13.37%
jan 1, 2001
0.31
-0.006
-1.9%
jan 1, 2002
0.289
-0.022
-6.94%
jan 1, 2003
0.21
-0.079
-27.21%
jan 1, 2004
0.208
-0.002
-1.18%
jan 1, 2005
0.191
-0.017
-8.23%
jan 1, 2006
0.174
-0.017
-8.68%
jan 1, 2007
0.186
+0.012
7.0%
jan 1, 2008
0.197
+0.01
5.53%
jan 1, 2009
0.157
-0.039
-20.06%
jan 1, 2010
0.145
-0.013
-8.05%
jan 1, 2011
0.168
+0.023
15.9%
jan 1, 2012
0.155
-0.013
-7.78%
jan 1, 2013
0.161
+0.007
4.31%
jan 1, 2014
0.164
+0.002
1.43%
Ranking of countries by current statistics by years