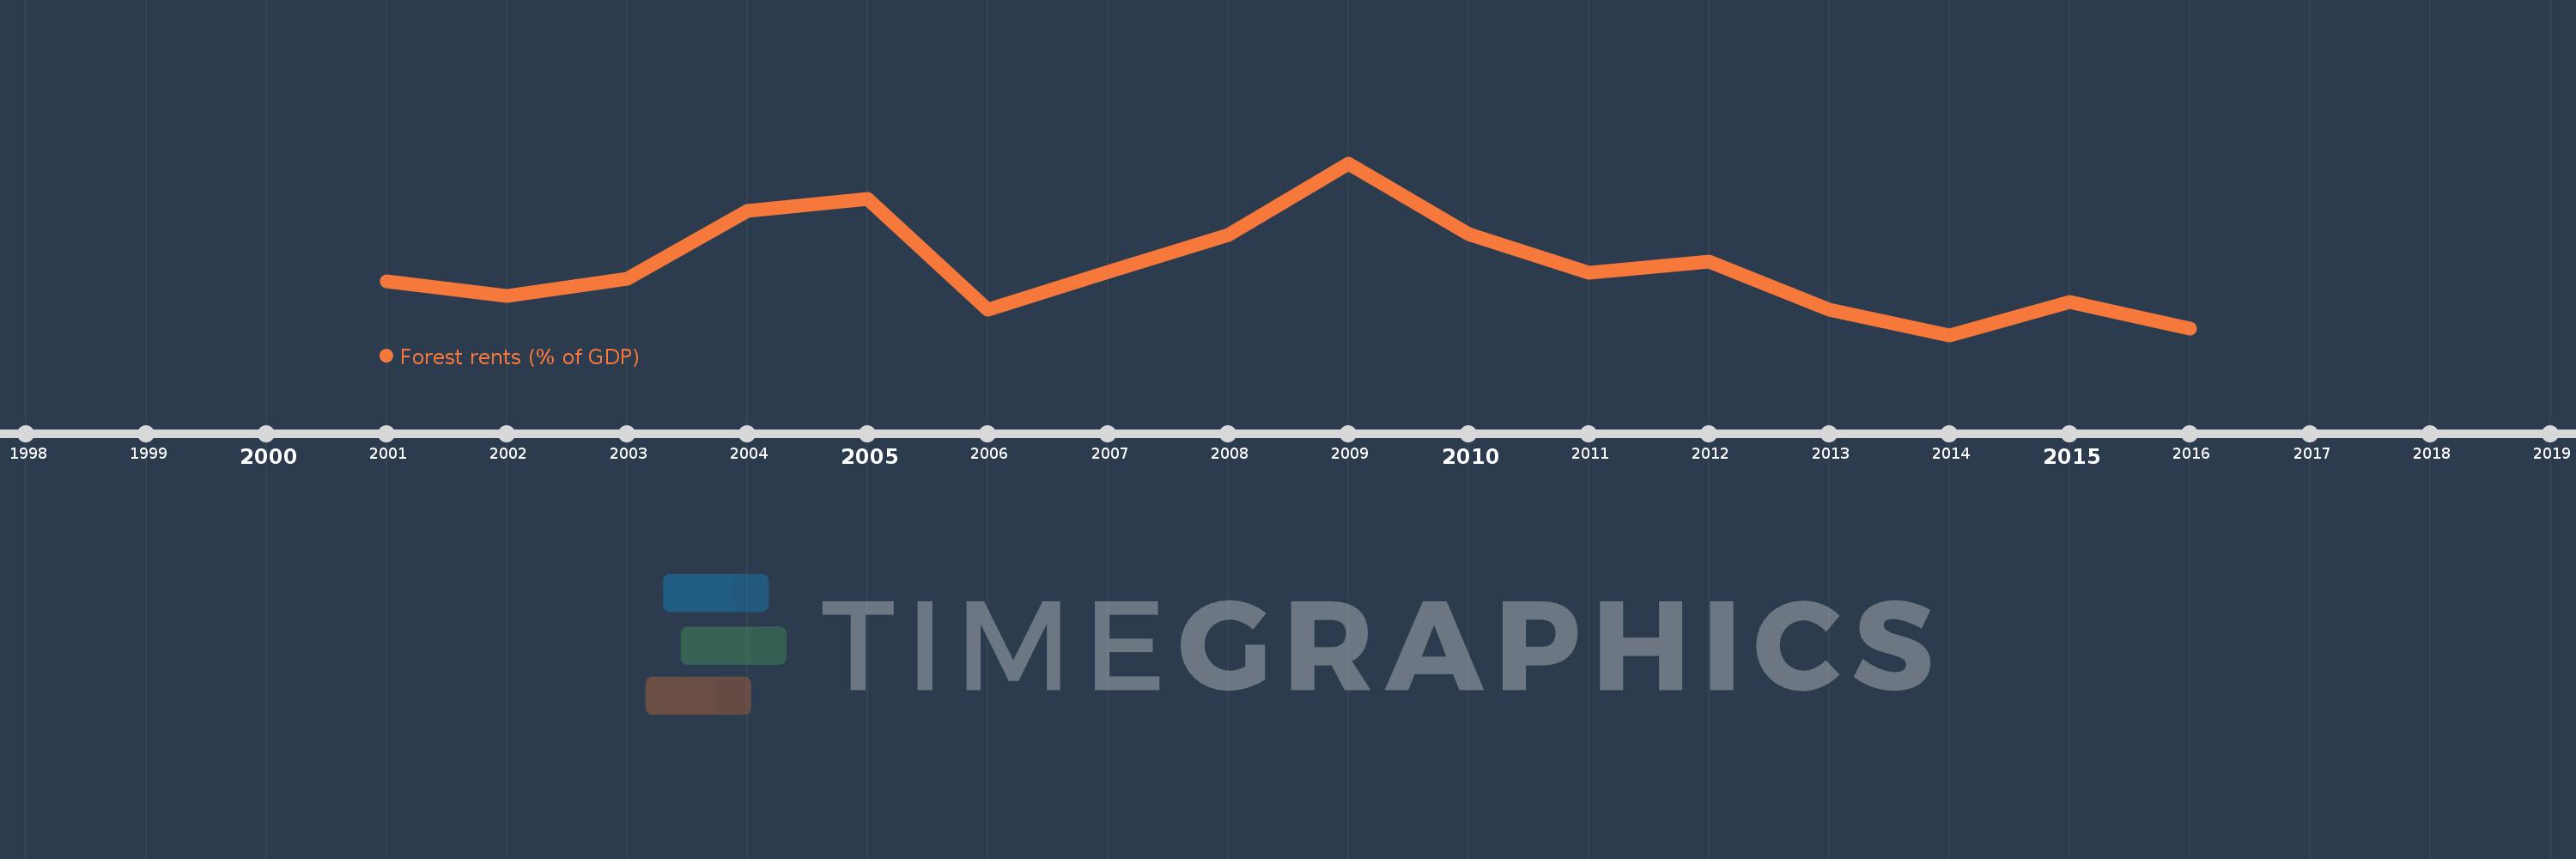
This timeline shows a graph from 2001 to 2016 of Timor-Leste. No data until 2000. Number of actual observations by date: 16.
Source name:
World Development Indicators
Source organization:
Estimates based on sources and methods described in "The Changing Wealth of Nations: Measuring Sustainable Development in the New Millennium" (World Bank, 2011).
Categories, topics:
Environment
Last updated:
apr 23, 2017
Indicators value changes by year
Meaning:
0.433
Minimum:
0.281
jan 1, 2014
Maximum:
0.67
jan 1, 2009
At the date of observation
Value
Absolute change
Change from the previous value
jan 1, 2001
0.403
+0.403
0.0%
jan 1, 2002
0.369
-0.033
-8.28%
jan 1, 2003
0.408
+0.039
10.45%
jan 1, 2004
0.563
+0.155
38.05%
jan 1, 2005
0.589
+0.025
4.53%
jan 1, 2006
0.339
-0.25
-42.44%
jan 1, 2007
0.424
+0.085
25.02%
jan 1, 2008
0.508
+0.084
19.95%
jan 1, 2009
0.67
+0.162
31.82%
jan 1, 2010
0.51
-0.159
-23.79%
jan 1, 2011
0.422
-0.088
-17.31%
jan 1, 2012
0.447
+0.025
5.87%
jan 1, 2013
0.339
-0.108
-24.16%
jan 1, 2014
0.281
-0.058
-17.09%
jan 1, 2015
0.356
+0.075
26.69%
jan 1, 2016
0.295
-0.061
-17.07%
Ranking of countries by current statistics by years