33
/
AIzaSyAYiBZKx7MnpbEhh9jyipgxe19OcubqV5w
August 1, 2025
152517
Hungary
HUN
true
2
1
Forest rents (% of GDP)
2016,2015,2014,2013,2012,2011,2010,2009,2008,2007,2006,2005,2004,2003,2002,2001,2000,1999,1998,1997,1996,1995,1994,1993,1992
Download
Global statistics library →Hungary →

Forest rents (% of GDP)

This statistics in other country:

AfghanistanAlbaniaAlgeriaAndorraAngolaArab WorldArgentinaArmeniaArubaAustraliaAustriaAzerbaijanBahamas, TheBahrainBangladeshBarbadosBelarusBelgiumBelizeBeninBhutanBoliviaBosnia and HerzegovinaBotswanaBrazilBrunei DarussalamBulgariaBurkina FasoBurundiCabo VerdeCambodiaCameroonCanadaCaribbean small statesCentral African RepublicCentral Europe and the BalticsChadChileChinaColombiaComorosCongo, Dem. Rep.Congo, Rep.Costa RicaCote d'IvoireCroatiaCubaCyprusCzech RepublicDenmarkDjiboutiDominicaDominican RepublicEarly-demographic dividendEast Asia & PacificEast Asia & Pacific (excluding high income)East Asia & Pacific (IDA & IBRD countries)EcuadorEgypt, Arab Rep.El SalvadorEquatorial GuineaEritreaEstoniaEthiopiaEuro areaEurope & Central AsiaEurope & Central Asia (excluding high income)Europe & Central Asia (IDA & IBRD countries)European UnionFaroe IslandsFijiFinlandFragile and conflict affected situationsFranceFrench PolynesiaGabonGambia, TheGeorgiaGermanyGhanaGreeceGuatemalaGuineaGuinea-BissauGuyanaHaitiHeavily indebted poor countries (HIPC)High incomeHondurasHong Kong SAR, ChinaHungaryIBRD onlyIcelandIDA & IBRD totalIDA blendIDA onlyIDA totalIndiaIndonesiaIran, Islamic Rep.IraqIrelandIsraelItalyJamaicaJapanJordanKazakhstanKenyaKiribatiKorea, Rep.KuwaitKyrgyz RepublicLao PDRLate-demographic dividendLatin America & Caribbean Latin America & Caribbean (excluding high income)Latin America & the Caribbean (IDA & IBRD countries)LatviaLeast developed countries: UN classificationLebanonLesothoLiberiaLibyaLiechtensteinLithuaniaLow & middle incomeLow incomeLower middle incomeLuxembourgMacao SAR, ChinaMacedonia, FYRMadagascarMalawiMalaysiaMaldivesMaliMaltaMauritaniaMauritiusMexicoMicronesia, Fed. Sts.Middle East & North AfricaMiddle East & North Africa (excluding high income)Middle East & North Africa (IDA & IBRD countries)Middle incomeMoldovaMongoliaMontenegroMoroccoMozambiqueMyanmarNamibiaNepalNetherlandsNew CaledoniaNew ZealandNicaraguaNigerNigeriaNorth AmericaNorwayOECD membersOmanOther small statesPacific island small statesPakistanPanamaPapua New GuineaParaguayPeruPhilippinesPolandPortugalPost-demographic dividendPre-demographic dividendQatarRomaniaRussian FederationRwandaSamoaSao Tome and PrincipeSaudi ArabiaSenegalSerbiaSeychellesSierra LeoneSingaporeSlovak RepublicSloveniaSmall statesSolomon IslandsSomaliaSouth AfricaSouth AsiaSouth Asia (IDA & IBRD)South SudanSpainSri LankaSt. LuciaSt. Vincent and the GrenadinesSub-Saharan Africa Sub-Saharan Africa (excluding high income)Sub-Saharan Africa (IDA & IBRD countries)SudanSurinameSwazilandSwedenSwitzerlandSyrian Arab RepublicTajikistanTanzaniaThailandTimor-LesteTogoTongaTrinidad and TobagoTunisiaTurkeyTurkmenistanUgandaUkraineUnited Arab EmiratesUnited KingdomUnited StatesUpper middle incomeUruguayUzbekistanVanuatuVenezuela, RBVietnamWorldYemen, Rep.ZambiaZimbabwe

Timeline:

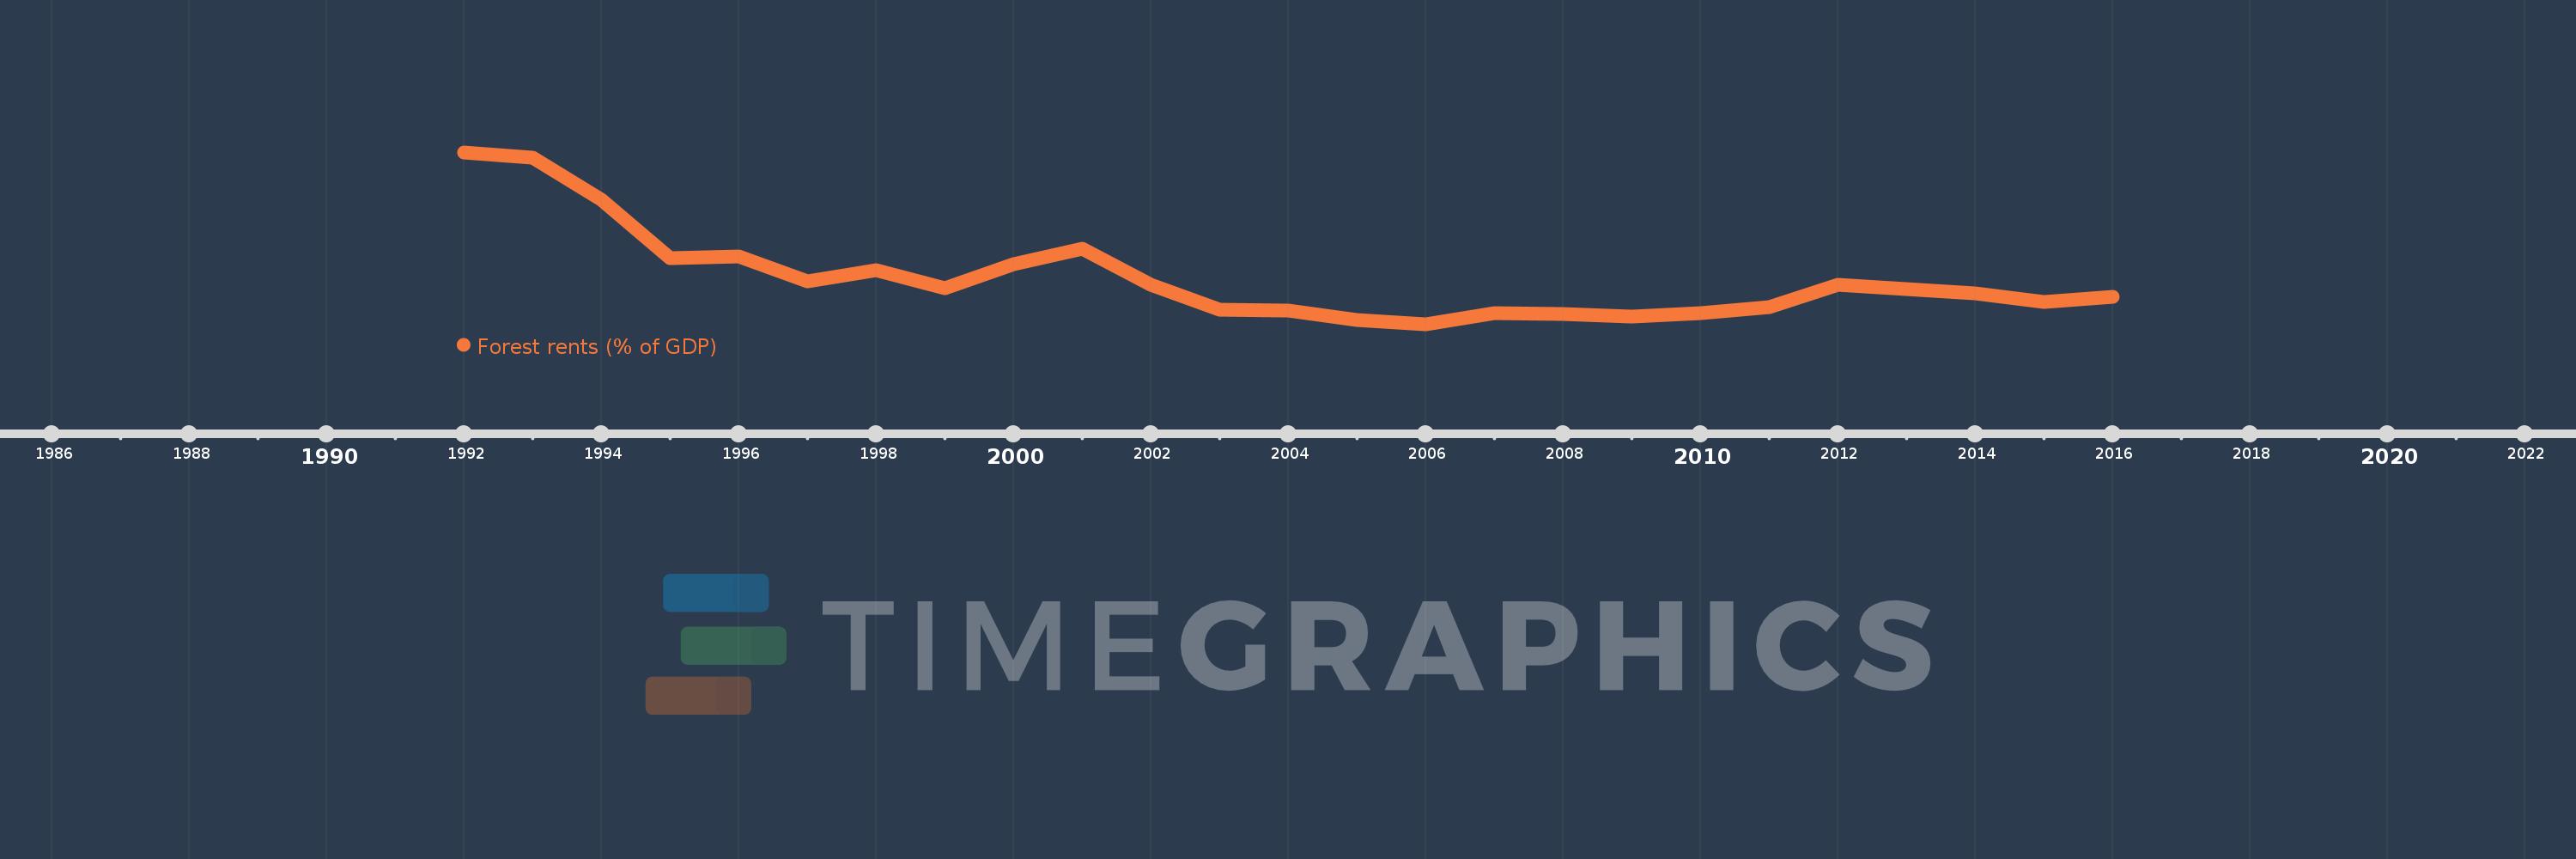
This timeline shows a graph from 1992 to 2016 of Hungary. No data until 1991. Number of actual observations by date: 25.

Source name:

World Development Indicators

Source organization:

Estimates based on sources and methods described in "The Changing Wealth of Nations: Measuring Sustainable Development in the New Millennium" (World Bank, 2011).

Categories, topics:

Environment

Last updated:

apr 23, 2017

Indicators value changes by year

Meaning:
0.139
Minimum:
0.082
jan 1, 2006
Maximum:
0.296
jan 1, 1992
At the date of observation
Value
Absolute change
Change from the previous value
jan 1, 1992
0.296
+0.296
0.0%
jan 1, 1993
0.289
-0.007
-2.27%
jan 1, 1994
0.237
-0.053
-18.22%
jan 1, 1995
0.164
-0.073
-30.84%
jan 1, 1996
0.166
+0.002
1.25%
jan 1, 1997
0.135
-0.031
-18.49%
jan 1, 1998
0.149
+0.014
10.43%
jan 1, 1999
0.127
-0.022
-14.56%
jan 1, 2000
0.157
+0.029
22.95%
jan 1, 2001
0.176
+0.02
12.61%
jan 1, 2002
0.131
-0.045
-25.76%
jan 1, 2003
0.1
-0.031
-23.87%
jan 1, 2004
0.099
-0.001
-1.16%
jan 1, 2005
0.087
-0.011
-11.34%
jan 1, 2006
0.082
-0.005
-5.82%
jan 1, 2007
0.096
+0.014
17.1%
jan 1, 2008
0.095
-0.001
-1.11%
jan 1, 2009
0.092
-0.003
-3.42%
jan 1, 2010
0.096
+0.004
3.85%
jan 1, 2011
0.103
+0.008
7.92%
jan 1, 2012
0.131
+0.028
27.1%
jan 1, 2013
0.126
-0.005
-3.95%
jan 1, 2014
0.12
-0.006
-4.71%
jan 1, 2015
0.11
-0.01
-8.66%
jan 1, 2016
0.116
+0.006
5.67%

Ranking of countries by current statistics by years