29
/
en
AIzaSyAYiBZKx7MnpbEhh9jyipgxe19OcubqV5w
April 1, 2024
96528
Burundi
BDI
true
2
1
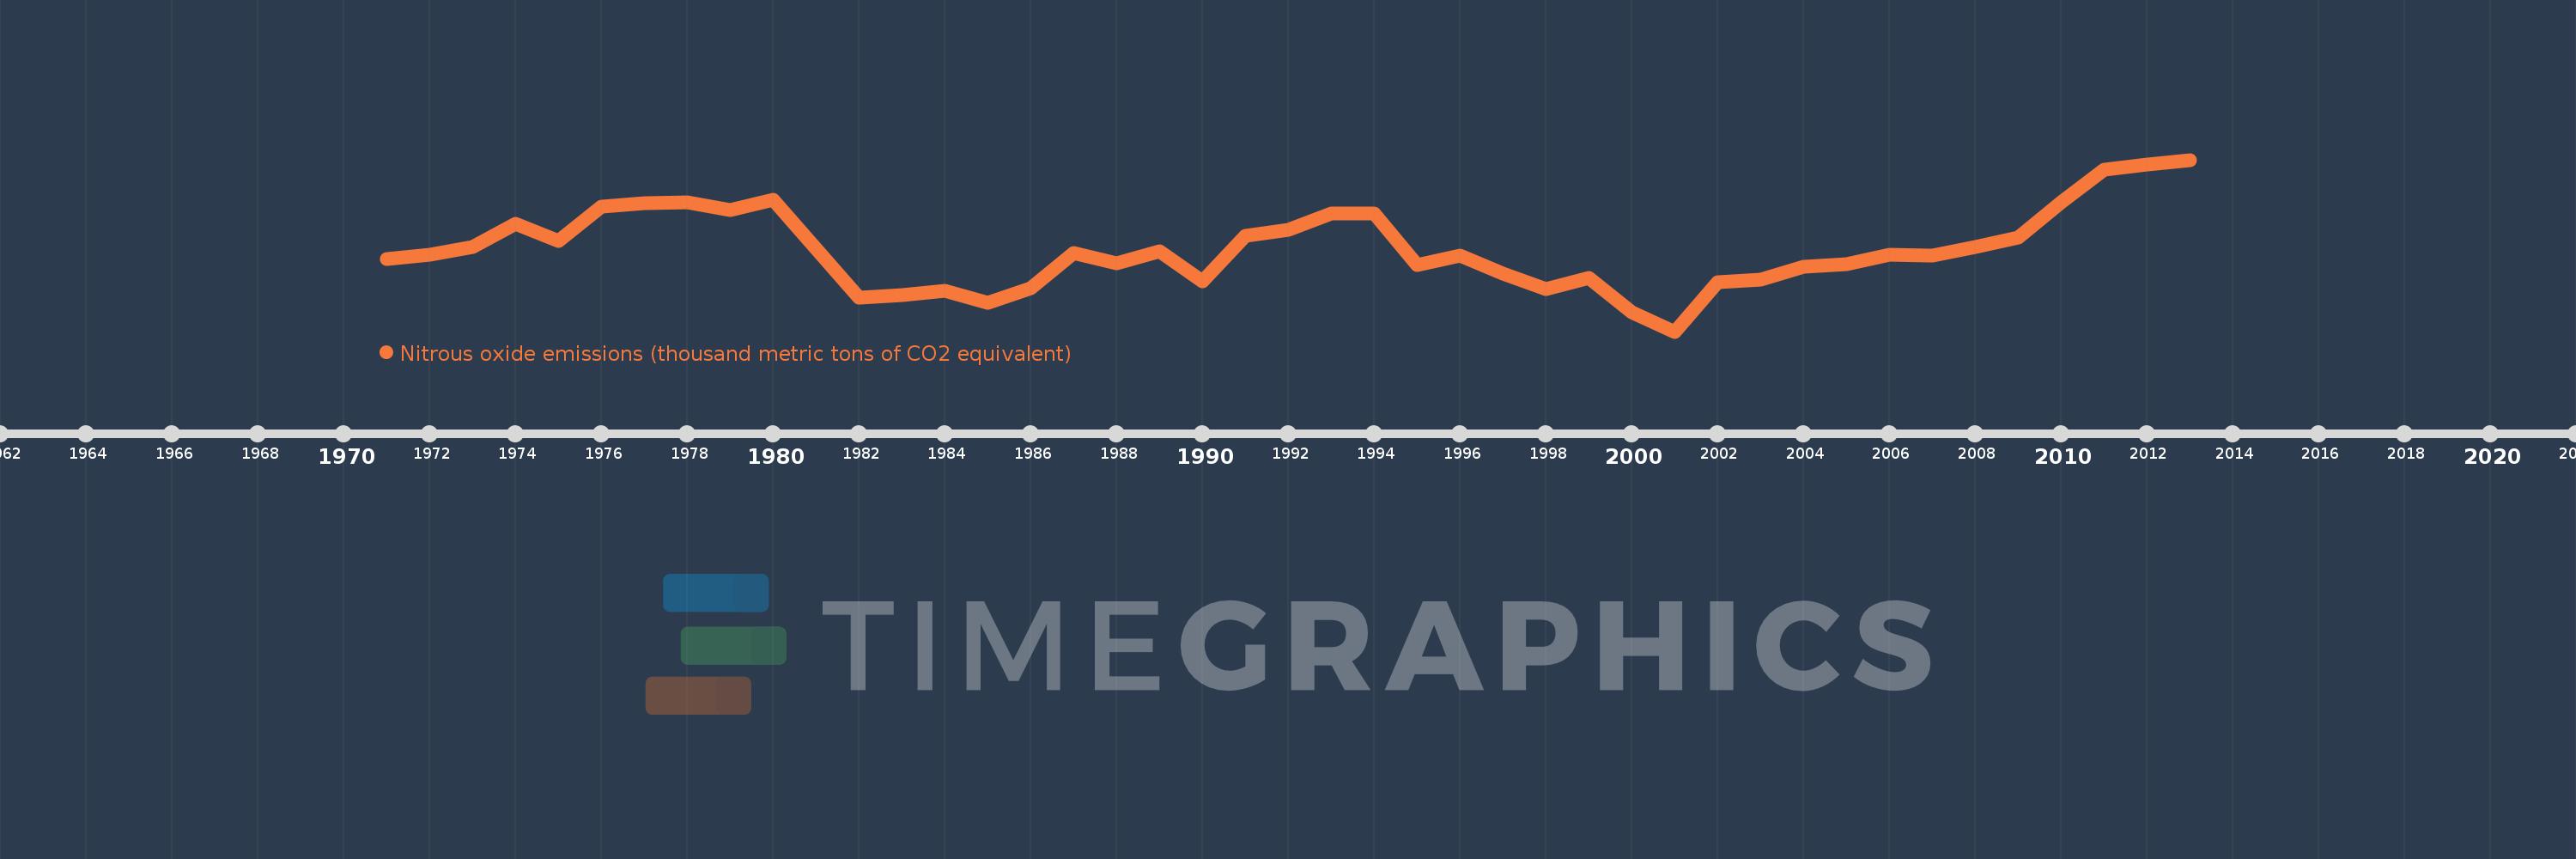
Nitrous oxide emissions (thousand metric tons of CO2 equivalent)
2013,2012,2011,2010,2009,2008,2007,2006,2005,2004,2003,2002,2001,2000,1999,1998,1997,1996,1995,1994,1993,1992,1991,1990,1989,1988,1987,1986,1985,1984,1983,1982,1981,1980,1979,1978,1977,1976,1975,1974,1973,1972,1971
This statistics in other country:
AfghanistanAlbaniaAlgeriaAmerican SamoaAndorraAngolaAntigua and BarbudaArab WorldArgentinaArmeniaArubaAustraliaAustriaAzerbaijanBahamas, TheBahrainBangladeshBarbadosBelarusBelgiumBelizeBeninBermudaBhutanBoliviaBosnia and HerzegovinaBotswanaBrazilBritish Virgin IslandsBrunei DarussalamBulgariaBurkina FasoBurundiCabo VerdeCambodiaCameroonCanadaCaribbean small statesCayman IslandsCentral African RepublicCentral Europe and the BalticsChadChileChinaColombiaComorosCongo, Dem. Rep.Congo, Rep.Costa RicaCote d'IvoireCroatiaCubaCyprusCzech RepublicDenmarkDjiboutiDominicaDominican RepublicEarly-demographic dividendEast Asia & PacificEast Asia & Pacific (excluding high income)East Asia & Pacific (IDA & IBRD countries)EcuadorEgypt, Arab Rep.El SalvadorEquatorial GuineaEritreaEstoniaEthiopiaEuro areaEurope & Central AsiaEurope & Central Asia (excluding high income)Europe & Central Asia (IDA & IBRD countries)European UnionFaroe IslandsFijiFinlandFragile and conflict affected situationsFranceFrench PolynesiaGabonGambia, TheGeorgiaGermanyGhanaGibraltarGreeceGreenlandGrenadaGuamGuatemalaGuineaGuinea-BissauGuyanaHaitiHeavily indebted poor countries (HIPC)High incomeHondurasHong Kong SAR, ChinaHungaryIBRD onlyIcelandIDA & IBRD totalIDA blendIDA onlyIDA totalIndiaIndonesiaIran, Islamic Rep.IraqIrelandIsraelItalyJamaicaJapanJordanKazakhstanKenyaKiribatiKorea, Dem. People’s Rep.Korea, Rep.KosovoKuwaitKyrgyz RepublicLao PDRLate-demographic dividendLatin America & Caribbean Latin America & Caribbean (excluding high income)Latin America & the Caribbean (IDA & IBRD countries)LatviaLeast developed countries: UN classificationLebanonLesothoLiberiaLibyaLithuaniaLow & middle incomeLow incomeLower middle incomeLuxembourgMacao SAR, ChinaMacedonia, FYRMadagascarMalawiMalaysiaMaldivesMaliMaltaMarshall IslandsMauritaniaMauritiusMexicoMicronesia, Fed. Sts.Middle East & North AfricaMiddle East & North Africa (excluding high income)Middle East & North Africa (IDA & IBRD countries)Middle incomeMoldovaMongoliaMontenegroMoroccoMozambiqueMyanmarNamibiaNauruNepalNetherlandsNew CaledoniaNew ZealandNicaraguaNigerNigeriaNorth AmericaNorthern Mariana IslandsNorwayOECD membersOmanOther small statesPacific island small statesPakistanPalauPanamaPapua New GuineaParaguayPeruPhilippinesPolandPortugalPost-demographic dividendPre-demographic dividendPuerto RicoQatarRomaniaRussian FederationRwandaSamoaSao Tome and PrincipeSaudi ArabiaSenegalSerbiaSeychellesSierra LeoneSingaporeSlovak RepublicSloveniaSmall statesSolomon IslandsSomaliaSouth AfricaSouth AsiaSouth Asia (IDA & IBRD)SpainSri LankaSt. Kitts and NevisSt. LuciaSt. Vincent and the GrenadinesSub-Saharan Africa Sub-Saharan Africa (excluding high income)Sub-Saharan Africa (IDA & IBRD countries)SudanSurinameSwazilandSwedenSwitzerlandSyrian Arab RepublicTajikistanTanzaniaThailandTimor-LesteTogoTongaTrinidad and TobagoTunisiaTurkeyTurkmenistanTurks and Caicos IslandsTuvaluUgandaUkraineUnited Arab EmiratesUnited KingdomUnited StatesUpper middle incomeUruguayUzbekistanVanuatuVenezuela, RBVietnamVirgin Islands (U.S.)WorldYemen, Rep.ZambiaZimbabwe Timeline:
This timeline shows a graph from 1971 to 2013 of Burundi. No data until 1970. Number of actual observations by date: 43.
Source name:
World Development Indicators
Source organization:
European Commission, Joint Research Centre (JRC)/Netherlands Environmental Assessment Agency (PBL). Emission Database for Global Atmospheric Research (EDGAR): http://edgar.jrc.ec.europa.eu/
Categories, topics:
Climate Change, Environment
Last updated:
apr 23, 2017
Indicators value changes by year
Minimum:
525.363
jan 1, 2001
Maximum:
789.485
jan 1, 2013
At the date of observation
Value
Absolute change
Change from previous value
jan 1, 1971
637.562
+637.562
0.0%
jan 1, 1972
643.083
+5.521
0.87%
jan 1, 1973
655.532
+12.45
1.94%
jan 1, 1974
690.513
+34.98
5.34%
jan 1, 1975
664.519
-25.994
-3.76%
jan 1, 1976
717.346
+52.827
7.95%
jan 1, 1977
723.047
+5.701
0.79%
jan 1, 1978
724.771
+1.724
0.24%
jan 1, 1979
712.107
-12.663
-1.75%
jan 1, 1980
728.314
+16.207
2.28%
jan 1, 1981
653.344
-74.97
-10.29%
jan 1, 1982
578.1
-75.243
-11.52%
jan 1, 1983
581.154
+3.053
0.53%
jan 1, 1984
588.098
+6.944
1.19%
jan 1, 1985
569.017
-19.081
-3.24%
jan 1, 1986
591.424
+22.407
3.94%
jan 1, 1987
646.319
+54.895
9.28%
jan 1, 1988
630.791
-15.528
-2.4%
jan 1, 1989
648.253
+17.462
2.77%
jan 1, 1990
602.113
-46.14
-7.12%
jan 1, 1991
672.781
+70.668
11.74%
jan 1, 1992
682.0
+9.219
1.37%
jan 1, 1993
707.28
+25.28
3.71%
jan 1, 1994
707.098
-0.183
-0.03%
jan 1, 1995
627.641
-79.456
-11.24%
jan 1, 1996
642.624
+14.982
2.39%
jan 1, 1997
614.16
-28.464
-4.43%
jan 1, 1998
590.888
-23.272
-3.79%
jan 1, 1999
608.183
+17.295
2.93%
jan 1, 2000
554.977
-53.205
-8.75%
jan 1, 2001
525.363
-29.614
-5.34%
jan 1, 2002
601.471
+76.108
14.49%
jan 1, 2003
605.281
+3.81
0.63%
jan 1, 2004
624.709
+19.428
3.21%
jan 1, 2005
629.17
+4.461
0.71%
jan 1, 2006
643.802
+14.632
2.33%
jan 1, 2007
642.41
-1.392
-0.22%
jan 1, 2008
655.495
+13.085
2.04%
jan 1, 2009
669.516
+14.021
2.14%
jan 1, 2010
724.253
+54.737
8.18%
jan 1, 2011
774.005
+49.752
6.87%
jan 1, 2012
781.745
+7.74
1.0%
jan 1, 2013
789.485
+7.74
0.99%
Ranking of countries by current statistics by years


Comments: