29
/
en
AIzaSyAYiBZKx7MnpbEhh9jyipgxe19OcubqV5w
April 1, 2024
228906
Romania
ROU
true
2
1
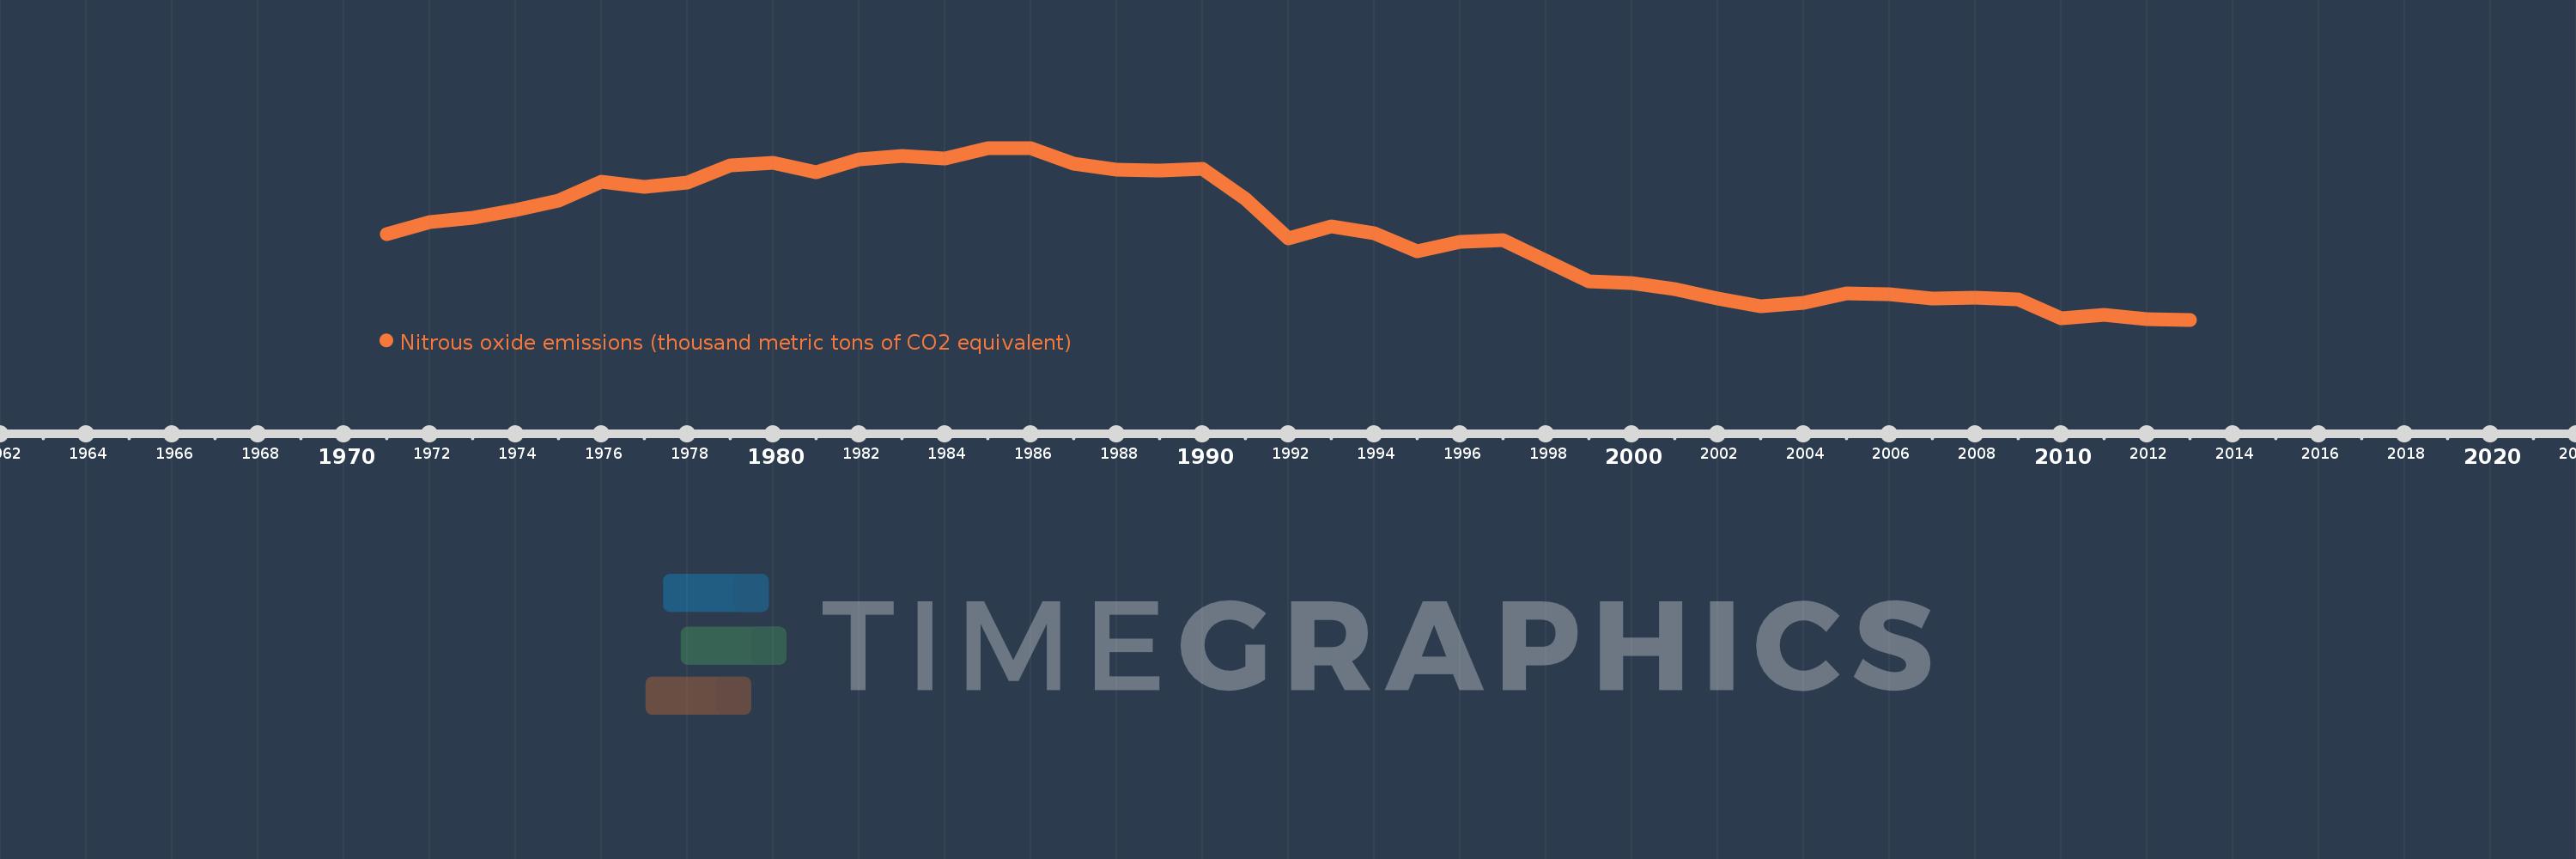
Nitrous oxide emissions (thousand metric tons of CO2 equivalent)
2013,2012,2011,2010,2009,2008,2007,2006,2005,2004,2003,2002,2001,2000,1999,1998,1997,1996,1995,1994,1993,1992,1991,1990,1989,1988,1987,1986,1985,1984,1983,1982,1981,1980,1979,1978,1977,1976,1975,1974,1973,1972,1971
This statistics in other country:
AfghanistanAlbaniaAlgeriaAmerican SamoaAndorraAngolaAntigua and BarbudaArab WorldArgentinaArmeniaArubaAustraliaAustriaAzerbaijanBahamas, TheBahrainBangladeshBarbadosBelarusBelgiumBelizeBeninBermudaBhutanBoliviaBosnia and HerzegovinaBotswanaBrazilBritish Virgin IslandsBrunei DarussalamBulgariaBurkina FasoBurundiCabo VerdeCambodiaCameroonCanadaCaribbean small statesCayman IslandsCentral African RepublicCentral Europe and the BalticsChadChileChinaColombiaComorosCongo, Dem. Rep.Congo, Rep.Costa RicaCote d'IvoireCroatiaCubaCyprusCzech RepublicDenmarkDjiboutiDominicaDominican RepublicEarly-demographic dividendEast Asia & PacificEast Asia & Pacific (excluding high income)East Asia & Pacific (IDA & IBRD countries)EcuadorEgypt, Arab Rep.El SalvadorEquatorial GuineaEritreaEstoniaEthiopiaEuro areaEurope & Central AsiaEurope & Central Asia (excluding high income)Europe & Central Asia (IDA & IBRD countries)European UnionFaroe IslandsFijiFinlandFragile and conflict affected situationsFranceFrench PolynesiaGabonGambia, TheGeorgiaGermanyGhanaGibraltarGreeceGreenlandGrenadaGuamGuatemalaGuineaGuinea-BissauGuyanaHaitiHeavily indebted poor countries (HIPC)High incomeHondurasHong Kong SAR, ChinaHungaryIBRD onlyIcelandIDA & IBRD totalIDA blendIDA onlyIDA totalIndiaIndonesiaIran, Islamic Rep.IraqIrelandIsraelItalyJamaicaJapanJordanKazakhstanKenyaKiribatiKorea, Dem. People’s Rep.Korea, Rep.KosovoKuwaitKyrgyz RepublicLao PDRLate-demographic dividendLatin America & Caribbean Latin America & Caribbean (excluding high income)Latin America & the Caribbean (IDA & IBRD countries)LatviaLeast developed countries: UN classificationLebanonLesothoLiberiaLibyaLithuaniaLow & middle incomeLow incomeLower middle incomeLuxembourgMacao SAR, ChinaMacedonia, FYRMadagascarMalawiMalaysiaMaldivesMaliMaltaMarshall IslandsMauritaniaMauritiusMexicoMicronesia, Fed. Sts.Middle East & North AfricaMiddle East & North Africa (excluding high income)Middle East & North Africa (IDA & IBRD countries)Middle incomeMoldovaMongoliaMontenegroMoroccoMozambiqueMyanmarNamibiaNauruNepalNetherlandsNew CaledoniaNew ZealandNicaraguaNigerNigeriaNorth AmericaNorthern Mariana IslandsNorwayOECD membersOmanOther small statesPacific island small statesPakistanPalauPanamaPapua New GuineaParaguayPeruPhilippinesPolandPortugalPost-demographic dividendPre-demographic dividendPuerto RicoQatarRomaniaRussian FederationRwandaSamoaSao Tome and PrincipeSaudi ArabiaSenegalSerbiaSeychellesSierra LeoneSingaporeSlovak RepublicSloveniaSmall statesSolomon IslandsSomaliaSouth AfricaSouth AsiaSouth Asia (IDA & IBRD)SpainSri LankaSt. Kitts and NevisSt. LuciaSt. Vincent and the GrenadinesSub-Saharan Africa Sub-Saharan Africa (excluding high income)Sub-Saharan Africa (IDA & IBRD countries)SudanSurinameSwazilandSwedenSwitzerlandSyrian Arab RepublicTajikistanTanzaniaThailandTimor-LesteTogoTongaTrinidad and TobagoTunisiaTurkeyTurkmenistanTurks and Caicos IslandsTuvaluUgandaUkraineUnited Arab EmiratesUnited KingdomUnited StatesUpper middle incomeUruguayUzbekistanVanuatuVenezuela, RBVietnamVirgin Islands (U.S.)WorldYemen, Rep.ZambiaZimbabwe Timeline:
This timeline shows a graph from 1971 to 2013 of Romania. No data until 1970. Number of actual observations by date: 43.
Source name:
World Development Indicators
Source organization:
European Commission, Joint Research Centre (JRC)/Netherlands Environmental Assessment Agency (PBL). Emission Database for Global Atmospheric Research (EDGAR): http://edgar.jrc.ec.europa.eu/
Categories, topics:
Climate Change, Environment
Last updated:
apr 23, 2017
Indicators value changes by year
Minimum:
8.218K
jan 1, 2013
Maximum:
27.966K
jan 1, 1986
At the date of observation
Value
Absolute change
Change from previous value
jan 1, 1971
18.06K
+18.06K
0.0%
jan 1, 1972
19.48K
+1.421K
7.87%
jan 1, 1973
19.923K
+442.184
2.27%
jan 1, 1974
20.844K
+921.816
4.63%
jan 1, 1975
21.939K
+1.094K
5.25%
jan 1, 1976
24.046K
+2.108K
9.61%
jan 1, 1977
23.531K
-515.22
-2.14%
jan 1, 1978
23.946K
+415.152
1.76%
jan 1, 1979
25.936K
+1.99K
8.31%
jan 1, 1980
26.274K
+337.528
1.3%
jan 1, 1981
25.202K
-1.072K
-4.08%
jan 1, 1982
26.69K
+1.489K
5.91%
jan 1, 1983
27.054K
+364.126
1.36%
jan 1, 1984
26.782K
-272.211
-1.01%
jan 1, 1985
27.943K
+1.161K
4.34%
jan 1, 1986
27.966K
+22.692
0.08%
jan 1, 1987
26.129K
-1.837K
-6.57%
jan 1, 1988
25.476K
-652.829
-2.5%
jan 1, 1989
25.376K
-100.409
-0.39%
jan 1, 1990
25.58K
+204.352
0.81%
jan 1, 1991
22.127K
-3.453K
-13.5%
jan 1, 1992
17.595K
-4.532K
-20.48%
jan 1, 1993
18.961K
+1.366K
7.76%
jan 1, 1994
18.152K
-809.193
-4.27%
jan 1, 1995
16.081K
-2.071K
-11.41%
jan 1, 1996
17.136K
+1.055K
6.56%
jan 1, 1997
17.379K
+242.637
1.42%
jan 1, 1998
15.001K
-2.377K
-13.68%
jan 1, 1999
12.628K
-2.373K
-15.82%
jan 1, 2000
12.418K
-209.87
-1.66%
jan 1, 2001
11.78K
-638.228
-5.14%
jan 1, 2002
10.679K
-1.101K
-9.35%
jan 1, 2003
9.783K
-895.621
-8.39%
jan 1, 2004
10.183K
+399.621
4.08%
jan 1, 2005
11.288K
+1.105K
10.85%
jan 1, 2006
11.169K
-118.792
-1.05%
jan 1, 2007
10.626K
-543.709
-4.87%
jan 1, 2008
10.742K
+116.653
1.1%
jan 1, 2009
10.593K
-149.482
-1.39%
jan 1, 2010
8.393K
-2.199K
-20.76%
jan 1, 2011
8.808K
+414.842
4.94%
jan 1, 2012
8.306K
-502.524
-5.71%
jan 1, 2013
8.218K
-87.682
-1.06%
Ranking of countries by current statistics by years


Comments: