29
/
en
AIzaSyAYiBZKx7MnpbEhh9jyipgxe19OcubqV5w
April 1, 2024
189372
Maldives
MDV
true
2
1
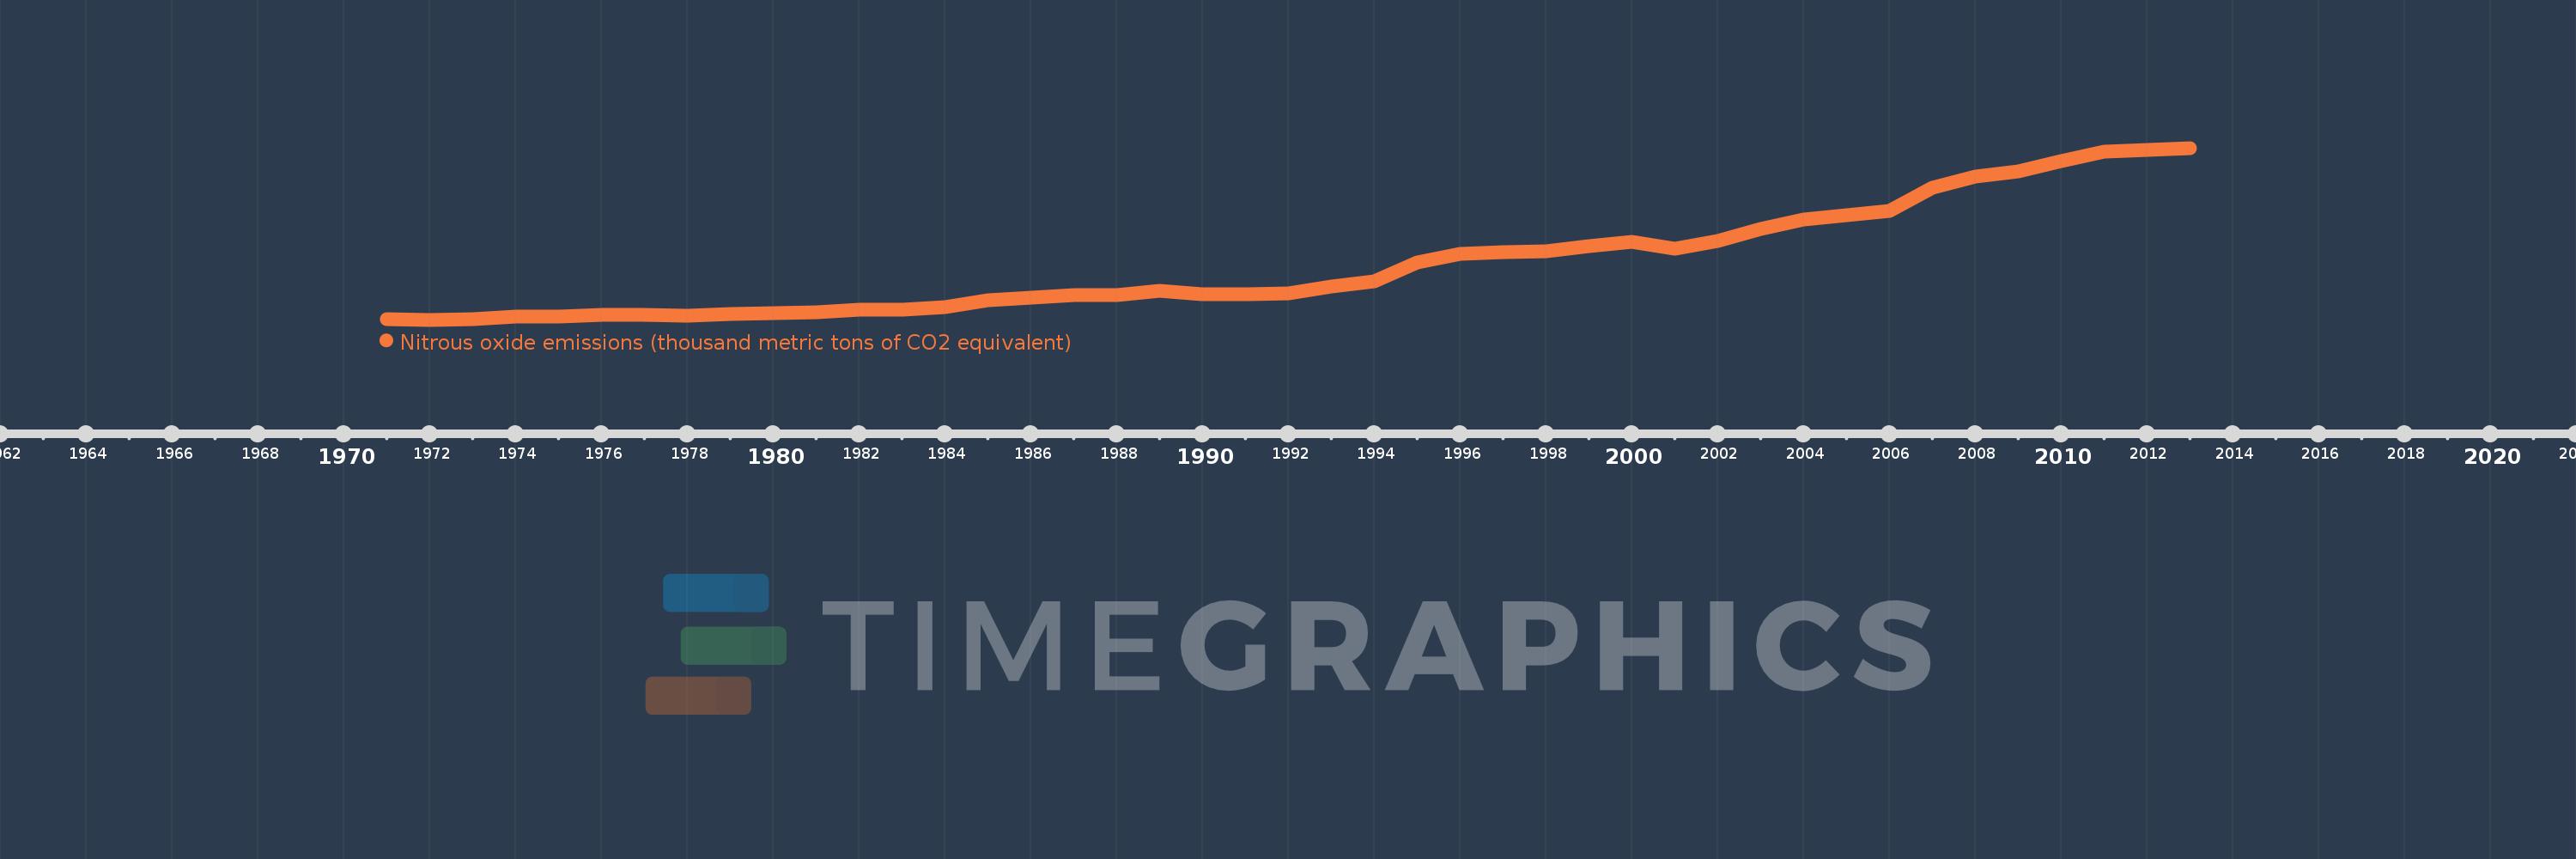
Nitrous oxide emissions (thousand metric tons of CO2 equivalent)
2013,2012,2011,2010,2009,2008,2007,2006,2005,2004,2003,2002,2001,2000,1999,1998,1997,1996,1995,1994,1993,1992,1991,1990,1989,1988,1987,1986,1985,1984,1983,1982,1981,1980,1979,1978,1977,1976,1975,1974,1973,1972,1971
This statistics in other country:
AfghanistanAlbaniaAlgeriaAmerican SamoaAndorraAngolaAntigua and BarbudaArab WorldArgentinaArmeniaArubaAustraliaAustriaAzerbaijanBahamas, TheBahrainBangladeshBarbadosBelarusBelgiumBelizeBeninBermudaBhutanBoliviaBosnia and HerzegovinaBotswanaBrazilBritish Virgin IslandsBrunei DarussalamBulgariaBurkina FasoBurundiCabo VerdeCambodiaCameroonCanadaCaribbean small statesCayman IslandsCentral African RepublicCentral Europe and the BalticsChadChileChinaColombiaComorosCongo, Dem. Rep.Congo, Rep.Costa RicaCote d'IvoireCroatiaCubaCyprusCzech RepublicDenmarkDjiboutiDominicaDominican RepublicEarly-demographic dividendEast Asia & PacificEast Asia & Pacific (excluding high income)East Asia & Pacific (IDA & IBRD countries)EcuadorEgypt, Arab Rep.El SalvadorEquatorial GuineaEritreaEstoniaEthiopiaEuro areaEurope & Central AsiaEurope & Central Asia (excluding high income)Europe & Central Asia (IDA & IBRD countries)European UnionFaroe IslandsFijiFinlandFragile and conflict affected situationsFranceFrench PolynesiaGabonGambia, TheGeorgiaGermanyGhanaGibraltarGreeceGreenlandGrenadaGuamGuatemalaGuineaGuinea-BissauGuyanaHaitiHeavily indebted poor countries (HIPC)High incomeHondurasHong Kong SAR, ChinaHungaryIBRD onlyIcelandIDA & IBRD totalIDA blendIDA onlyIDA totalIndiaIndonesiaIran, Islamic Rep.IraqIrelandIsraelItalyJamaicaJapanJordanKazakhstanKenyaKiribatiKorea, Dem. People’s Rep.Korea, Rep.KosovoKuwaitKyrgyz RepublicLao PDRLate-demographic dividendLatin America & Caribbean Latin America & Caribbean (excluding high income)Latin America & the Caribbean (IDA & IBRD countries)LatviaLeast developed countries: UN classificationLebanonLesothoLiberiaLibyaLithuaniaLow & middle incomeLow incomeLower middle incomeLuxembourgMacao SAR, ChinaMacedonia, FYRMadagascarMalawiMalaysiaMaldivesMaliMaltaMarshall IslandsMauritaniaMauritiusMexicoMicronesia, Fed. Sts.Middle East & North AfricaMiddle East & North Africa (excluding high income)Middle East & North Africa (IDA & IBRD countries)Middle incomeMoldovaMongoliaMontenegroMoroccoMozambiqueMyanmarNamibiaNauruNepalNetherlandsNew CaledoniaNew ZealandNicaraguaNigerNigeriaNorth AmericaNorthern Mariana IslandsNorwayOECD membersOmanOther small statesPacific island small statesPakistanPalauPanamaPapua New GuineaParaguayPeruPhilippinesPolandPortugalPost-demographic dividendPre-demographic dividendPuerto RicoQatarRomaniaRussian FederationRwandaSamoaSao Tome and PrincipeSaudi ArabiaSenegalSerbiaSeychellesSierra LeoneSingaporeSlovak RepublicSloveniaSmall statesSolomon IslandsSomaliaSouth AfricaSouth AsiaSouth Asia (IDA & IBRD)SpainSri LankaSt. Kitts and NevisSt. LuciaSt. Vincent and the GrenadinesSub-Saharan Africa Sub-Saharan Africa (excluding high income)Sub-Saharan Africa (IDA & IBRD countries)SudanSurinameSwazilandSwedenSwitzerlandSyrian Arab RepublicTajikistanTanzaniaThailandTimor-LesteTogoTongaTrinidad and TobagoTunisiaTurkeyTurkmenistanTurks and Caicos IslandsTuvaluUgandaUkraineUnited Arab EmiratesUnited KingdomUnited StatesUpper middle incomeUruguayUzbekistanVanuatuVenezuela, RBVietnamVirgin Islands (U.S.)WorldYemen, Rep.ZambiaZimbabwe Timeline:
This timeline shows a graph from 1971 to 2013 of Maldives. No data until 1970. Number of actual observations by date: 43.
Source name:
World Development Indicators
Source organization:
European Commission, Joint Research Centre (JRC)/Netherlands Environmental Assessment Agency (PBL). Emission Database for Global Atmospheric Research (EDGAR): http://edgar.jrc.ec.europa.eu/
Categories, topics:
Climate Change, Environment
Last updated:
apr 23, 2017
Indicators value changes by year
Maximum:
27.151
jan 1, 2013
At the date of observation
Value
Absolute change
Change from previous value
jan 1, 1971
2.249
+2.249
0.0%
jan 1, 1972
2.11
-0.139
-6.17%
jan 1, 1973
2.152
+0.042
1.97%
jan 1, 1974
2.543
+0.391
18.16%
jan 1, 1975
2.622
+0.079
3.11%
jan 1, 1976
2.772
+0.15
5.74%
jan 1, 1977
2.763
-0.01
-0.36%
jan 1, 1978
2.756
-0.007
-0.24%
jan 1, 1979
3.007
+0.251
9.11%
jan 1, 1980
3.052
+0.045
1.49%
jan 1, 1981
3.249
+0.197
6.46%
jan 1, 1982
3.59
+0.341
10.5%
jan 1, 1983
3.614
+0.024
0.66%
jan 1, 1984
3.961
+0.347
9.6%
jan 1, 1985
4.902
+0.942
23.78%
jan 1, 1986
5.277
+0.375
7.64%
jan 1, 1987
5.669
+0.392
7.42%
jan 1, 1988
5.761
+0.093
1.63%
jan 1, 1989
6.319
+0.558
9.68%
jan 1, 1990
5.813
-0.506
-8.01%
jan 1, 1991
5.825
+0.012
0.2%
jan 1, 1992
5.939
+0.114
1.96%
jan 1, 1993
6.936
+0.996
16.78%
jan 1, 1994
7.662
+0.726
10.47%
jan 1, 1995
10.425
+2.764
36.07%
jan 1, 1996
11.737
+1.312
12.58%
jan 1, 1997
11.984
+0.247
2.1%
jan 1, 1998
12.046
+0.062
0.52%
jan 1, 1999
12.846
+0.8
6.64%
jan 1, 2000
13.406
+0.56
4.36%
jan 1, 2001
12.45
-0.956
-7.13%
jan 1, 2002
13.568
+1.118
8.98%
jan 1, 2003
15.327
+1.759
12.96%
jan 1, 2004
16.719
+1.392
9.08%
jan 1, 2005
17.306
+0.587
3.51%
jan 1, 2006
17.955
+0.649
3.75%
jan 1, 2007
21.416
+3.462
19.28%
jan 1, 2008
22.963
+1.547
7.22%
jan 1, 2009
23.773
+0.81
3.53%
jan 1, 2010
25.228
+1.455
6.12%
jan 1, 2011
26.619
+1.391
5.51%
jan 1, 2012
26.885
+0.266
1.0%
jan 1, 2013
27.151
+0.266
0.99%
Ranking of countries by current statistics by years


Comments: