29
/
en
AIzaSyAYiBZKx7MnpbEhh9jyipgxe19OcubqV5w
April 1, 2024
135003
French Polynesia
PYF
true
2
1
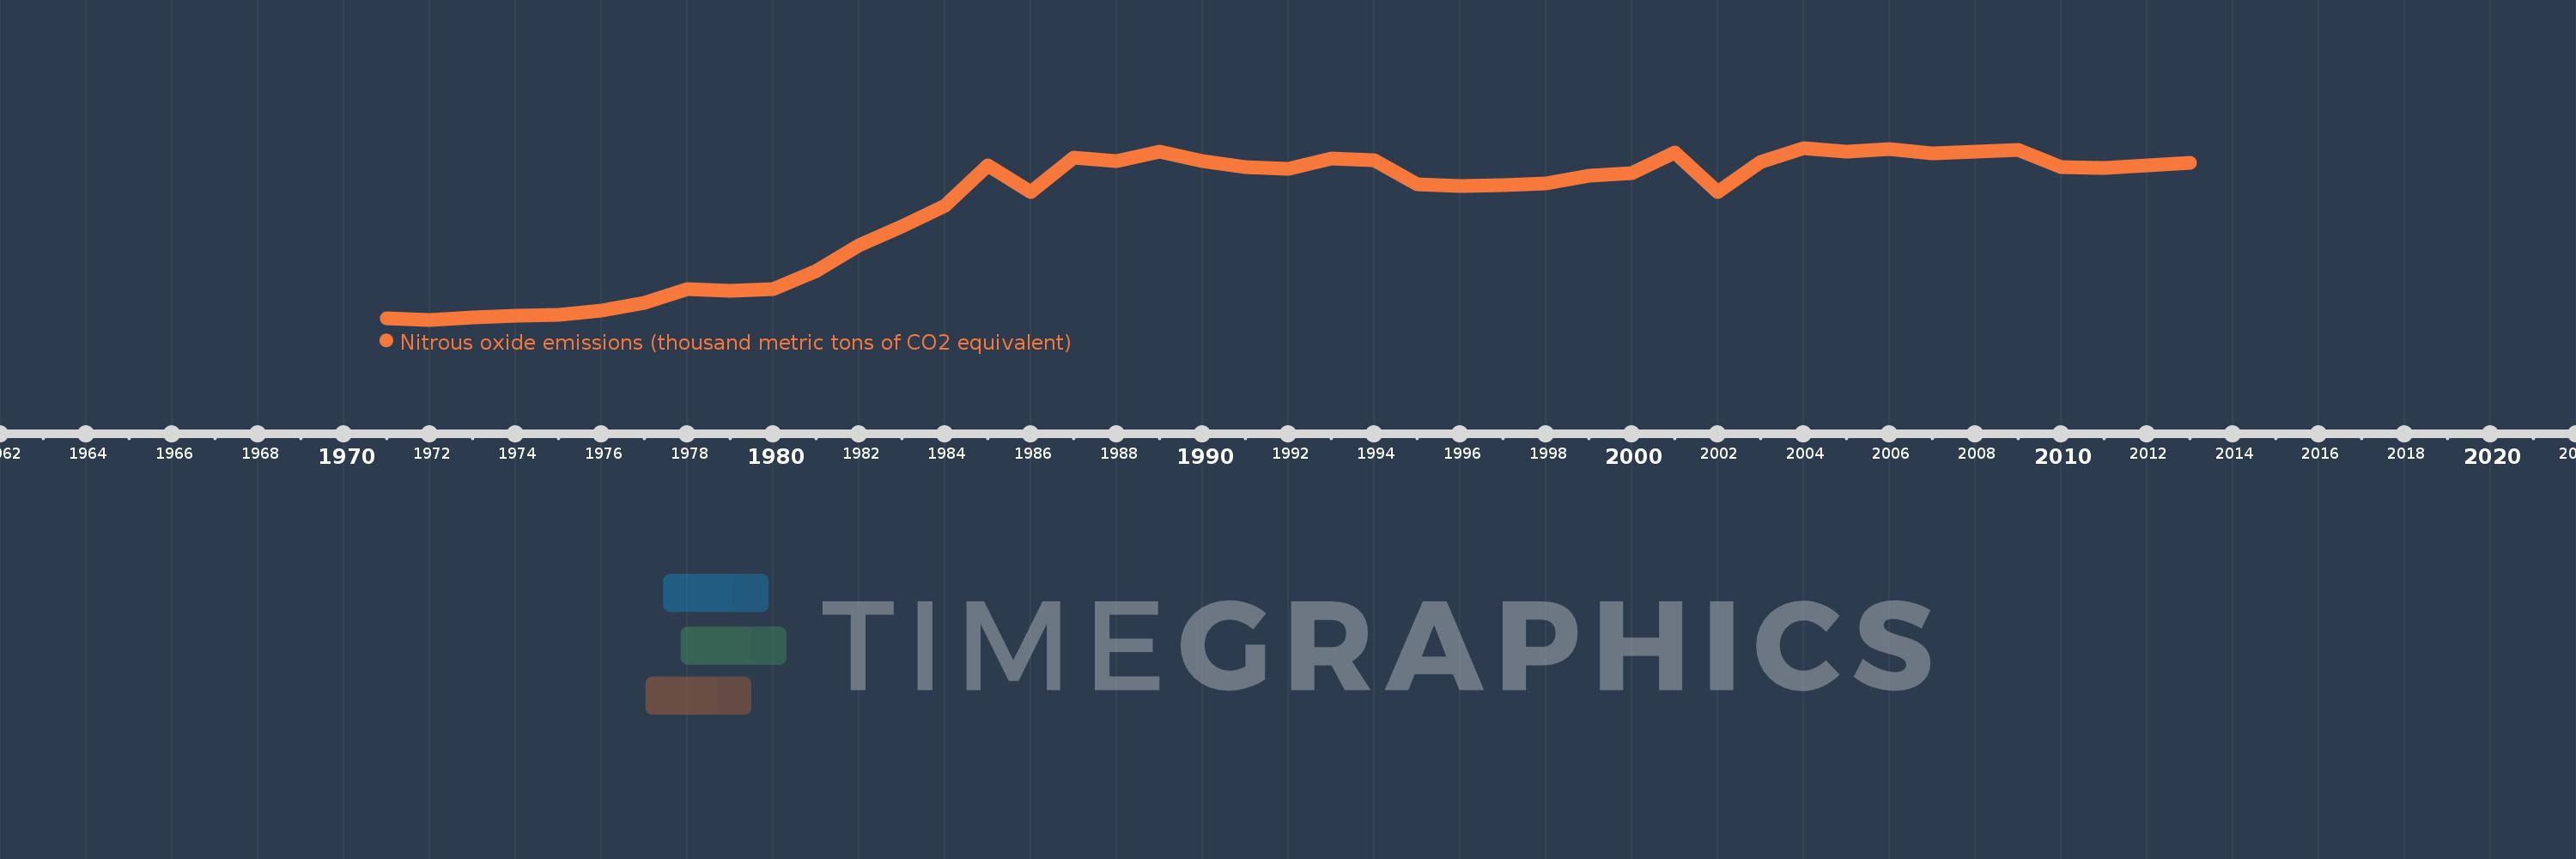
Nitrous oxide emissions (thousand metric tons of CO2 equivalent)
2013,2012,2011,2010,2009,2008,2007,2006,2005,2004,2003,2002,2001,2000,1999,1998,1997,1996,1995,1994,1993,1992,1991,1990,1989,1988,1987,1986,1985,1984,1983,1982,1981,1980,1979,1978,1977,1976,1975,1974,1973,1972,1971
This statistics in other country:
AfghanistanAlbaniaAlgeriaAmerican SamoaAndorraAngolaAntigua and BarbudaArab WorldArgentinaArmeniaArubaAustraliaAustriaAzerbaijanBahamas, TheBahrainBangladeshBarbadosBelarusBelgiumBelizeBeninBermudaBhutanBoliviaBosnia and HerzegovinaBotswanaBrazilBritish Virgin IslandsBrunei DarussalamBulgariaBurkina FasoBurundiCabo VerdeCambodiaCameroonCanadaCaribbean small statesCayman IslandsCentral African RepublicCentral Europe and the BalticsChadChileChinaColombiaComorosCongo, Dem. Rep.Congo, Rep.Costa RicaCote d'IvoireCroatiaCubaCyprusCzech RepublicDenmarkDjiboutiDominicaDominican RepublicEarly-demographic dividendEast Asia & PacificEast Asia & Pacific (excluding high income)East Asia & Pacific (IDA & IBRD countries)EcuadorEgypt, Arab Rep.El SalvadorEquatorial GuineaEritreaEstoniaEthiopiaEuro areaEurope & Central AsiaEurope & Central Asia (excluding high income)Europe & Central Asia (IDA & IBRD countries)European UnionFaroe IslandsFijiFinlandFragile and conflict affected situationsFranceFrench PolynesiaGabonGambia, TheGeorgiaGermanyGhanaGibraltarGreeceGreenlandGrenadaGuamGuatemalaGuineaGuinea-BissauGuyanaHaitiHeavily indebted poor countries (HIPC)High incomeHondurasHong Kong SAR, ChinaHungaryIBRD onlyIcelandIDA & IBRD totalIDA blendIDA onlyIDA totalIndiaIndonesiaIran, Islamic Rep.IraqIrelandIsraelItalyJamaicaJapanJordanKazakhstanKenyaKiribatiKorea, Dem. People’s Rep.Korea, Rep.KosovoKuwaitKyrgyz RepublicLao PDRLate-demographic dividendLatin America & Caribbean Latin America & Caribbean (excluding high income)Latin America & the Caribbean (IDA & IBRD countries)LatviaLeast developed countries: UN classificationLebanonLesothoLiberiaLibyaLithuaniaLow & middle incomeLow incomeLower middle incomeLuxembourgMacao SAR, ChinaMacedonia, FYRMadagascarMalawiMalaysiaMaldivesMaliMaltaMarshall IslandsMauritaniaMauritiusMexicoMicronesia, Fed. Sts.Middle East & North AfricaMiddle East & North Africa (excluding high income)Middle East & North Africa (IDA & IBRD countries)Middle incomeMoldovaMongoliaMontenegroMoroccoMozambiqueMyanmarNamibiaNauruNepalNetherlandsNew CaledoniaNew ZealandNicaraguaNigerNigeriaNorth AmericaNorthern Mariana IslandsNorwayOECD membersOmanOther small statesPacific island small statesPakistanPalauPanamaPapua New GuineaParaguayPeruPhilippinesPolandPortugalPost-demographic dividendPre-demographic dividendPuerto RicoQatarRomaniaRussian FederationRwandaSamoaSao Tome and PrincipeSaudi ArabiaSenegalSerbiaSeychellesSierra LeoneSingaporeSlovak RepublicSloveniaSmall statesSolomon IslandsSomaliaSouth AfricaSouth AsiaSouth Asia (IDA & IBRD)SpainSri LankaSt. Kitts and NevisSt. LuciaSt. Vincent and the GrenadinesSub-Saharan Africa Sub-Saharan Africa (excluding high income)Sub-Saharan Africa (IDA & IBRD countries)SudanSurinameSwazilandSwedenSwitzerlandSyrian Arab RepublicTajikistanTanzaniaThailandTimor-LesteTogoTongaTrinidad and TobagoTunisiaTurkeyTurkmenistanTurks and Caicos IslandsTuvaluUgandaUkraineUnited Arab EmiratesUnited KingdomUnited StatesUpper middle incomeUruguayUzbekistanVanuatuVenezuela, RBVietnamVirgin Islands (U.S.)WorldYemen, Rep.ZambiaZimbabwe Timeline:
This timeline shows a graph from 1971 to 2013 of French Polynesia. No data until 1970. Number of actual observations by date: 43.
Source name:
World Development Indicators
Source organization:
European Commission, Joint Research Centre (JRC)/Netherlands Environmental Assessment Agency (PBL). Emission Database for Global Atmospheric Research (EDGAR): http://edgar.jrc.ec.europa.eu/
Categories, topics:
Climate Change, Environment
Last updated:
apr 23, 2017
Indicators value changes by year
Minimum:
12.556
jan 1, 1972
Maximum:
39.802
jan 1, 2004
At the date of observation
Value
Absolute change
Change from previous value
jan 1, 1971
12.814
+12.814
0.0%
jan 1, 1972
12.556
-0.258
-2.01%
jan 1, 1973
12.863
+0.307
2.45%
jan 1, 1974
13.173
+0.31
2.41%
jan 1, 1975
13.283
+0.11
0.83%
jan 1, 1976
14.04
+0.757
5.7%
jan 1, 1977
15.221
+1.181
8.41%
jan 1, 1978
17.4
+2.18
14.32%
jan 1, 1979
17.148
-0.252
-1.45%
jan 1, 1980
17.42
+0.271
1.58%
jan 1, 1981
20.324
+2.904
16.67%
jan 1, 1982
24.382
+4.058
19.97%
jan 1, 1983
27.31
+2.929
12.01%
jan 1, 1984
30.653
+3.342
12.24%
jan 1, 1985
36.969
+6.316
20.6%
jan 1, 1986
32.876
-4.093
-11.07%
jan 1, 1987
38.22
+5.344
16.26%
jan 1, 1988
37.784
-0.436
-1.14%
jan 1, 1989
39.203
+1.419
3.76%
jan 1, 1990
37.653
-1.55
-3.95%
jan 1, 1991
36.779
-0.875
-2.32%
jan 1, 1992
36.47
-0.308
-0.84%
jan 1, 1993
38.126
+1.656
4.54%
jan 1, 1994
37.809
-0.317
-0.83%
jan 1, 1995
33.992
-3.817
-10.1%
jan 1, 1996
33.827
-0.165
-0.48%
jan 1, 1997
33.959
+0.132
0.39%
jan 1, 1998
34.19
+0.231
0.68%
jan 1, 1999
35.401
+1.211
3.54%
jan 1, 2000
35.763
+0.363
1.02%
jan 1, 2001
39.118
+3.355
9.38%
jan 1, 2002
32.831
-6.287
-16.07%
jan 1, 2003
37.552
+4.721
14.38%
jan 1, 2004
39.802
+2.249
5.99%
jan 1, 2005
39.19
-0.612
-1.54%
jan 1, 2006
39.579
+0.389
0.99%
jan 1, 2007
38.971
-0.608
-1.54%
jan 1, 2008
39.227
+0.257
0.66%
jan 1, 2009
39.439
+0.211
0.54%
jan 1, 2010
36.701
-2.738
-6.94%
jan 1, 2011
36.678
-0.024
-0.06%
jan 1, 2012
37.044
+0.367
1.0%
jan 1, 2013
37.411
+0.367
0.99%
Ranking of countries by current statistics by years


Comments: