29
/
en
AIzaSyAYiBZKx7MnpbEhh9jyipgxe19OcubqV5w
April 1, 2024
182400
Luxembourg
LUX
true
2
1
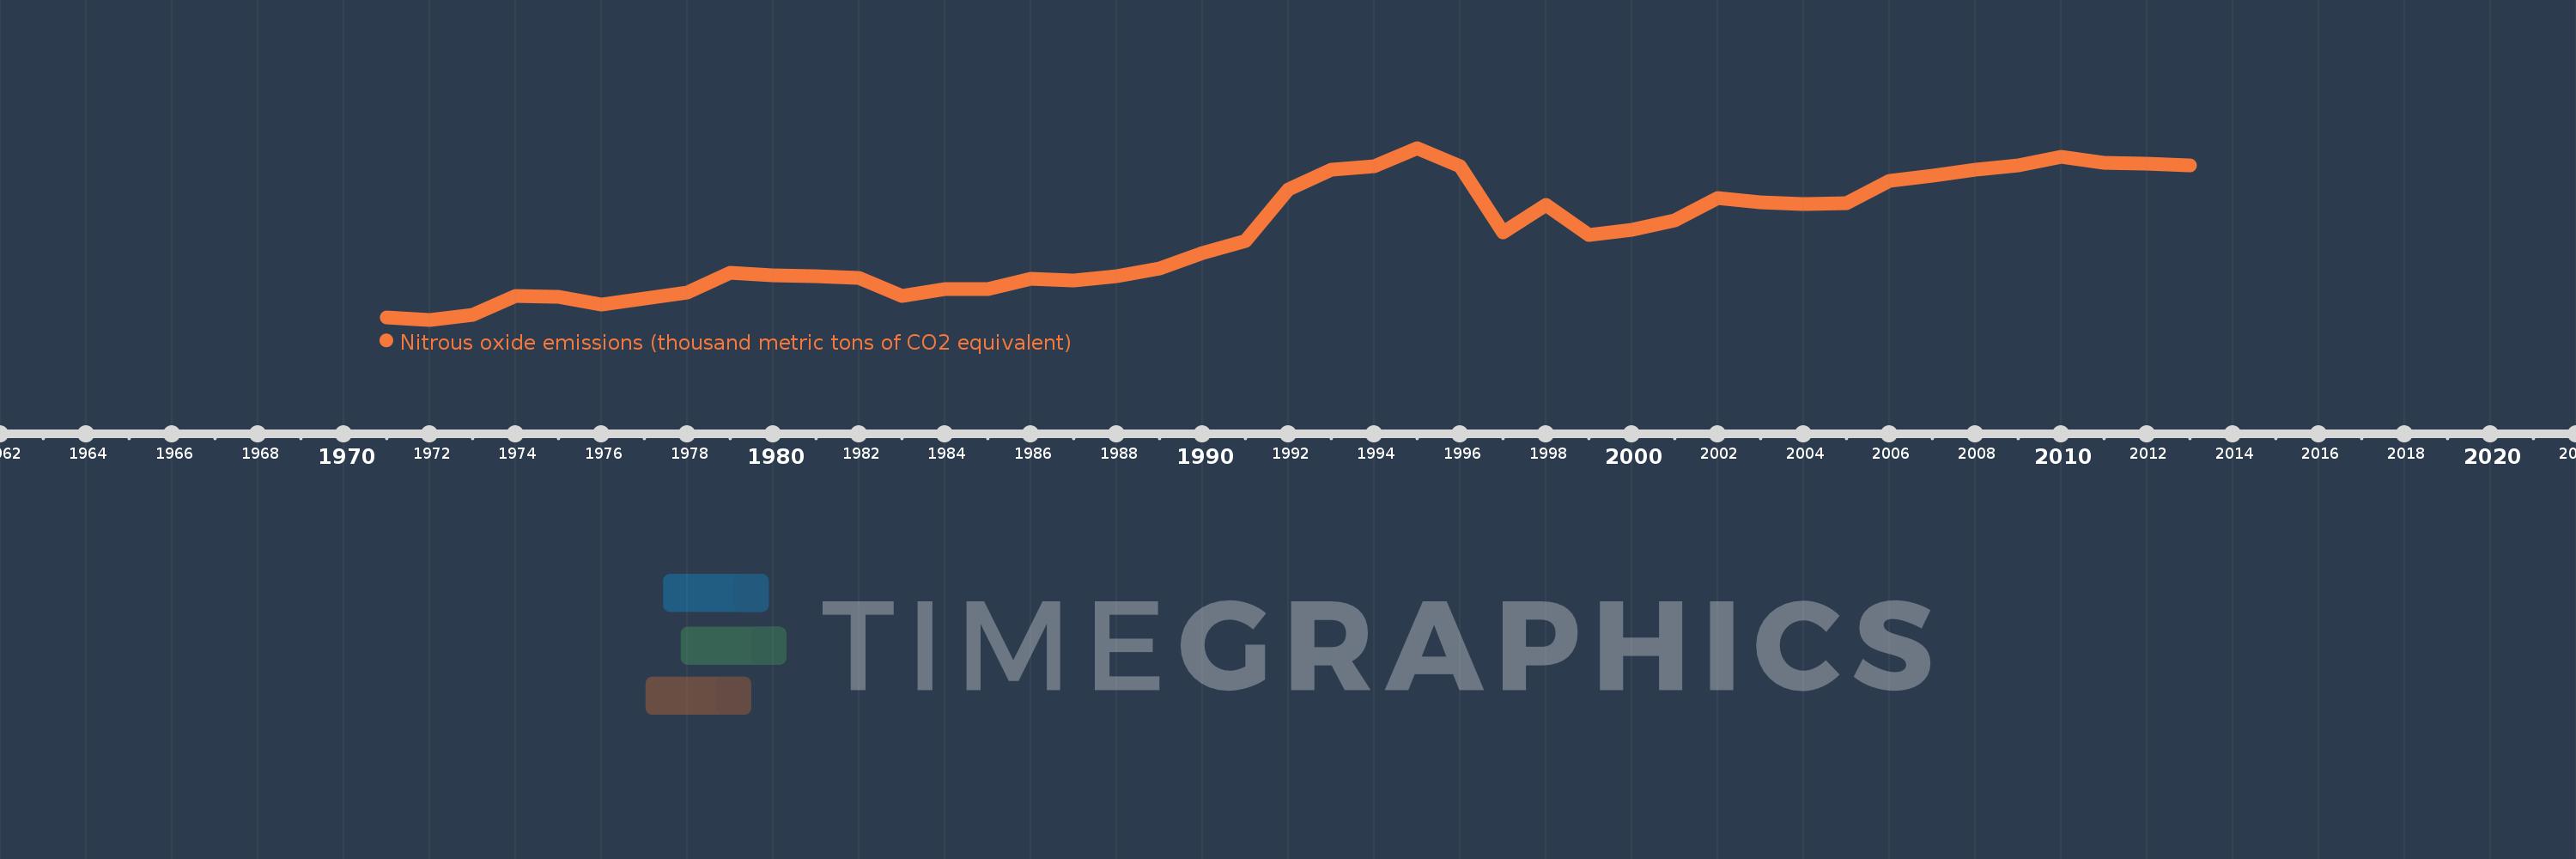
Nitrous oxide emissions (thousand metric tons of CO2 equivalent)
2013,2012,2011,2010,2009,2008,2007,2006,2005,2004,2003,2002,2001,2000,1999,1998,1997,1996,1995,1994,1993,1992,1991,1990,1989,1988,1987,1986,1985,1984,1983,1982,1981,1980,1979,1978,1977,1976,1975,1974,1973,1972,1971
This statistics in other country:
AfghanistanAlbaniaAlgeriaAmerican SamoaAndorraAngolaAntigua and BarbudaArab WorldArgentinaArmeniaArubaAustraliaAustriaAzerbaijanBahamas, TheBahrainBangladeshBarbadosBelarusBelgiumBelizeBeninBermudaBhutanBoliviaBosnia and HerzegovinaBotswanaBrazilBritish Virgin IslandsBrunei DarussalamBulgariaBurkina FasoBurundiCabo VerdeCambodiaCameroonCanadaCaribbean small statesCayman IslandsCentral African RepublicCentral Europe and the BalticsChadChileChinaColombiaComorosCongo, Dem. Rep.Congo, Rep.Costa RicaCote d'IvoireCroatiaCubaCyprusCzech RepublicDenmarkDjiboutiDominicaDominican RepublicEarly-demographic dividendEast Asia & PacificEast Asia & Pacific (excluding high income)East Asia & Pacific (IDA & IBRD countries)EcuadorEgypt, Arab Rep.El SalvadorEquatorial GuineaEritreaEstoniaEthiopiaEuro areaEurope & Central AsiaEurope & Central Asia (excluding high income)Europe & Central Asia (IDA & IBRD countries)European UnionFaroe IslandsFijiFinlandFragile and conflict affected situationsFranceFrench PolynesiaGabonGambia, TheGeorgiaGermanyGhanaGibraltarGreeceGreenlandGrenadaGuamGuatemalaGuineaGuinea-BissauGuyanaHaitiHeavily indebted poor countries (HIPC)High incomeHondurasHong Kong SAR, ChinaHungaryIBRD onlyIcelandIDA & IBRD totalIDA blendIDA onlyIDA totalIndiaIndonesiaIran, Islamic Rep.IraqIrelandIsraelItalyJamaicaJapanJordanKazakhstanKenyaKiribatiKorea, Dem. People’s Rep.Korea, Rep.KosovoKuwaitKyrgyz RepublicLao PDRLate-demographic dividendLatin America & Caribbean Latin America & Caribbean (excluding high income)Latin America & the Caribbean (IDA & IBRD countries)LatviaLeast developed countries: UN classificationLebanonLesothoLiberiaLibyaLithuaniaLow & middle incomeLow incomeLower middle incomeLuxembourgMacao SAR, ChinaMacedonia, FYRMadagascarMalawiMalaysiaMaldivesMaliMaltaMarshall IslandsMauritaniaMauritiusMexicoMicronesia, Fed. Sts.Middle East & North AfricaMiddle East & North Africa (excluding high income)Middle East & North Africa (IDA & IBRD countries)Middle incomeMoldovaMongoliaMontenegroMoroccoMozambiqueMyanmarNamibiaNauruNepalNetherlandsNew CaledoniaNew ZealandNicaraguaNigerNigeriaNorth AmericaNorthern Mariana IslandsNorwayOECD membersOmanOther small statesPacific island small statesPakistanPalauPanamaPapua New GuineaParaguayPeruPhilippinesPolandPortugalPost-demographic dividendPre-demographic dividendPuerto RicoQatarRomaniaRussian FederationRwandaSamoaSao Tome and PrincipeSaudi ArabiaSenegalSerbiaSeychellesSierra LeoneSingaporeSlovak RepublicSloveniaSmall statesSolomon IslandsSomaliaSouth AfricaSouth AsiaSouth Asia (IDA & IBRD)SpainSri LankaSt. Kitts and NevisSt. LuciaSt. Vincent and the GrenadinesSub-Saharan Africa Sub-Saharan Africa (excluding high income)Sub-Saharan Africa (IDA & IBRD countries)SudanSurinameSwazilandSwedenSwitzerlandSyrian Arab RepublicTajikistanTanzaniaThailandTimor-LesteTogoTongaTrinidad and TobagoTunisiaTurkeyTurkmenistanTurks and Caicos IslandsTuvaluUgandaUkraineUnited Arab EmiratesUnited KingdomUnited StatesUpper middle incomeUruguayUzbekistanVanuatuVenezuela, RBVietnamVirgin Islands (U.S.)WorldYemen, Rep.ZambiaZimbabwe Timeline:
This timeline shows a graph from 1971 to 2013 of Luxembourg. No data until 1970. Number of actual observations by date: 43.
Source name:
World Development Indicators
Source organization:
European Commission, Joint Research Centre (JRC)/Netherlands Environmental Assessment Agency (PBL). Emission Database for Global Atmospheric Research (EDGAR): http://edgar.jrc.ec.europa.eu/
Categories, topics:
Climate Change, Environment
Last updated:
apr 23, 2017
Indicators value changes by year
Minimum:
318.144
jan 1, 1972
Maximum:
490.445
jan 1, 1995
At the date of observation
Value
Absolute change
Change from previous value
jan 1, 1971
320.515
+320.515
0.0%
jan 1, 1972
318.144
-2.371
-0.74%
jan 1, 1973
323.02
+4.876
1.53%
jan 1, 1974
341.58
+18.56
5.75%
jan 1, 1975
341.189
-0.391
-0.11%
jan 1, 1976
333.039
-8.15
-2.39%
jan 1, 1977
339.224
+6.185
1.86%
jan 1, 1978
345.572
+6.349
1.87%
jan 1, 1979
365.67
+20.097
5.82%
jan 1, 1980
362.44
-3.23
-0.88%
jan 1, 1981
361.807
-0.632
-0.17%
jan 1, 1982
360.254
-1.553
-0.43%
jan 1, 1983
341.914
-18.34
-5.09%
jan 1, 1984
349.079
+7.164
2.1%
jan 1, 1985
348.486
-0.592
-0.17%
jan 1, 1986
359.488
+11.002
3.16%
jan 1, 1987
357.632
-1.857
-0.52%
jan 1, 1988
362.154
+4.523
1.26%
jan 1, 1989
369.684
+7.53
2.08%
jan 1, 1990
385.324
+15.639
4.23%
jan 1, 1991
397.274
+11.95
3.1%
jan 1, 1992
449.004
+51.73
13.02%
jan 1, 1993
468.832
+19.828
4.42%
jan 1, 1994
472.204
+3.373
0.72%
jan 1, 1995
490.445
+18.24
3.86%
jan 1, 1996
472.517
-17.927
-3.66%
jan 1, 1997
405.682
-66.836
-14.14%
jan 1, 1998
432.955
+27.274
6.72%
jan 1, 1999
403.276
-29.679
-6.86%
jan 1, 2000
408.378
+5.103
1.27%
jan 1, 2001
418.233
+9.855
2.41%
jan 1, 2002
439.98
+21.746
5.2%
jan 1, 2003
436.337
-3.642
-0.83%
jan 1, 2004
433.811
-2.526
-0.58%
jan 1, 2005
434.766
+0.955
0.22%
jan 1, 2006
457.709
+22.943
5.28%
jan 1, 2007
462.659
+4.951
1.08%
jan 1, 2008
468.249
+5.589
1.21%
jan 1, 2009
472.691
+4.442
0.95%
jan 1, 2010
481.966
+9.275
1.96%
jan 1, 2011
475.819
-6.147
-1.28%
jan 1, 2012
474.421
-1.398
-0.29%
jan 1, 2013
473.024
-1.398
-0.29%
Ranking of countries by current statistics by years


Comments: