29
/
en
AIzaSyAYiBZKx7MnpbEhh9jyipgxe19OcubqV5w
April 1, 2024
37652
IDA & IBRD total
IBT
false
2
1
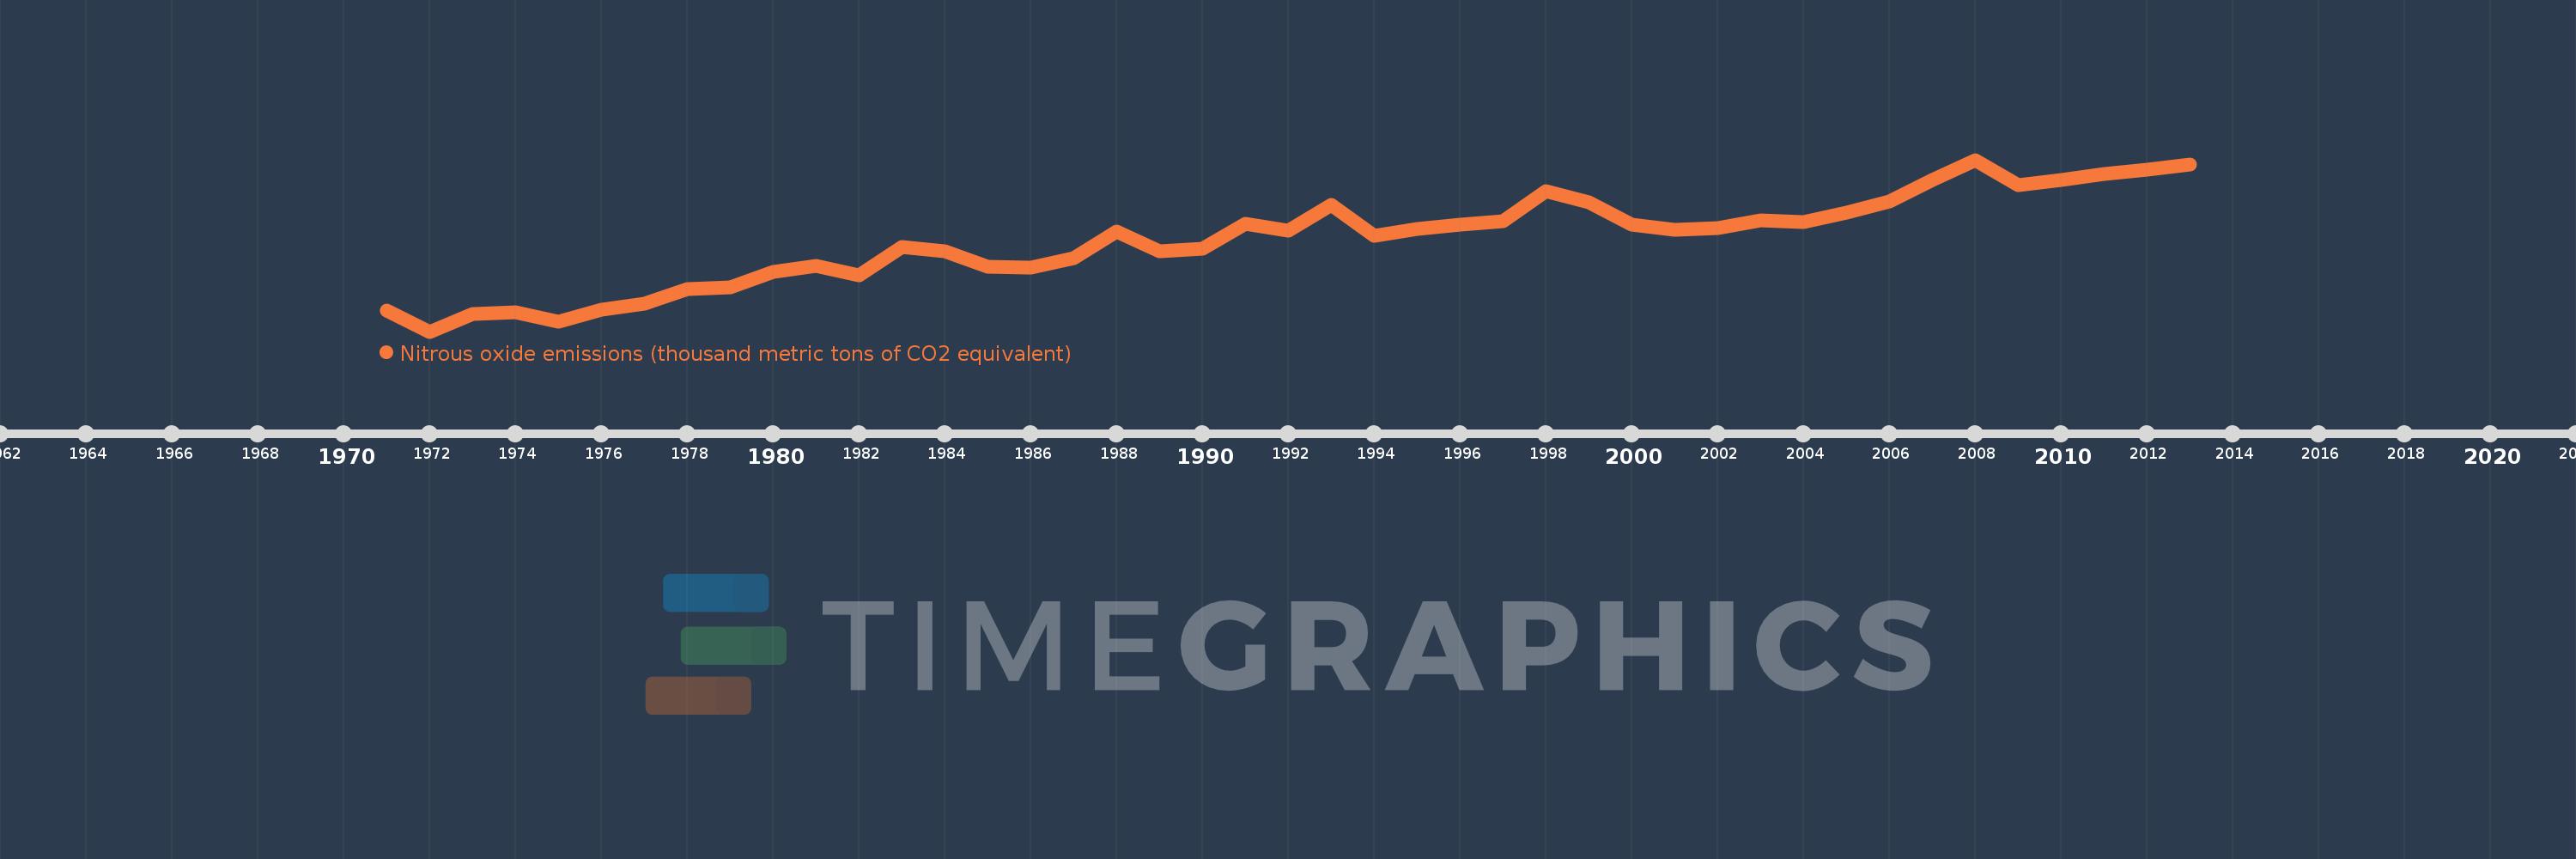
Nitrous oxide emissions (thousand metric tons of CO2 equivalent)
2013,2012,2011,2010,2009,2008,2007,2006,2005,2004,2003,2002,2001,2000,1999,1998,1997,1996,1995,1994,1993,1992,1991,1990,1989,1988,1987,1986,1985,1984,1983,1982,1981,1980,1979,1978,1977,1976,1975,1974,1973,1972,1971
This statistics in other country:
AfghanistanAlbaniaAlgeriaAmerican SamoaAndorraAngolaAntigua and BarbudaArab WorldArgentinaArmeniaArubaAustraliaAustriaAzerbaijanBahamas, TheBahrainBangladeshBarbadosBelarusBelgiumBelizeBeninBermudaBhutanBoliviaBosnia and HerzegovinaBotswanaBrazilBritish Virgin IslandsBrunei DarussalamBulgariaBurkina FasoBurundiCabo VerdeCambodiaCameroonCanadaCaribbean small statesCayman IslandsCentral African RepublicCentral Europe and the BalticsChadChileChinaColombiaComorosCongo, Dem. Rep.Congo, Rep.Costa RicaCote d'IvoireCroatiaCubaCyprusCzech RepublicDenmarkDjiboutiDominicaDominican RepublicEarly-demographic dividendEast Asia & PacificEast Asia & Pacific (excluding high income)East Asia & Pacific (IDA & IBRD countries)EcuadorEgypt, Arab Rep.El SalvadorEquatorial GuineaEritreaEstoniaEthiopiaEuro areaEurope & Central AsiaEurope & Central Asia (excluding high income)Europe & Central Asia (IDA & IBRD countries)European UnionFaroe IslandsFijiFinlandFragile and conflict affected situationsFranceFrench PolynesiaGabonGambia, TheGeorgiaGermanyGhanaGibraltarGreeceGreenlandGrenadaGuamGuatemalaGuineaGuinea-BissauGuyanaHaitiHeavily indebted poor countries (HIPC)High incomeHondurasHong Kong SAR, ChinaHungaryIBRD onlyIcelandIDA & IBRD totalIDA blendIDA onlyIDA totalIndiaIndonesiaIran, Islamic Rep.IraqIrelandIsraelItalyJamaicaJapanJordanKazakhstanKenyaKiribatiKorea, Dem. People’s Rep.Korea, Rep.KosovoKuwaitKyrgyz RepublicLao PDRLate-demographic dividendLatin America & Caribbean Latin America & Caribbean (excluding high income)Latin America & the Caribbean (IDA & IBRD countries)LatviaLeast developed countries: UN classificationLebanonLesothoLiberiaLibyaLithuaniaLow & middle incomeLow incomeLower middle incomeLuxembourgMacao SAR, ChinaMacedonia, FYRMadagascarMalawiMalaysiaMaldivesMaliMaltaMarshall IslandsMauritaniaMauritiusMexicoMicronesia, Fed. Sts.Middle East & North AfricaMiddle East & North Africa (excluding high income)Middle East & North Africa (IDA & IBRD countries)Middle incomeMoldovaMongoliaMontenegroMoroccoMozambiqueMyanmarNamibiaNauruNepalNetherlandsNew CaledoniaNew ZealandNicaraguaNigerNigeriaNorth AmericaNorthern Mariana IslandsNorwayOECD membersOmanOther small statesPacific island small statesPakistanPalauPanamaPapua New GuineaParaguayPeruPhilippinesPolandPortugalPost-demographic dividendPre-demographic dividendPuerto RicoQatarRomaniaRussian FederationRwandaSamoaSao Tome and PrincipeSaudi ArabiaSenegalSerbiaSeychellesSierra LeoneSingaporeSlovak RepublicSloveniaSmall statesSolomon IslandsSomaliaSouth AfricaSouth AsiaSouth Asia (IDA & IBRD)SpainSri LankaSt. Kitts and NevisSt. LuciaSt. Vincent and the GrenadinesSub-Saharan Africa Sub-Saharan Africa (excluding high income)Sub-Saharan Africa (IDA & IBRD countries)SudanSurinameSwazilandSwedenSwitzerlandSyrian Arab RepublicTajikistanTanzaniaThailandTimor-LesteTogoTongaTrinidad and TobagoTunisiaTurkeyTurkmenistanTurks and Caicos IslandsTuvaluUgandaUkraineUnited Arab EmiratesUnited KingdomUnited StatesUpper middle incomeUruguayUzbekistanVanuatuVenezuela, RBVietnamVirgin Islands (U.S.)WorldYemen, Rep.ZambiaZimbabwe Timeline:
This timeline shows a graph from 1971 to 2013 of IDA & IBRD total. No data until 1970. Number of actual observations by date: 43.
Source name:
World Development Indicators
Source organization:
European Commission, Joint Research Centre (JRC)/Netherlands Environmental Assessment Agency (PBL). Emission Database for Global Atmospheric Research (EDGAR): http://edgar.jrc.ec.europa.eu/
Categories, topics:
Climate Change, Environment
Last updated:
apr 23, 2017
Indicators value changes by year
Minimum:
1.231 mln
jan 1, 1972
Maximum:
2.469 mln
jan 1, 2008
At the date of observation
Value
Absolute change
Change from previous value
jan 1, 1971
1.38 mln
+1.38 mln
0.0%
jan 1, 1972
1.231 mln
-149.079K
-10.8%
jan 1, 1973
1.355 mln
+124.122K
10.08%
jan 1, 1974
1.37 mln
+14.941K
1.1%
jan 1, 1975
1.303 mln
-66.783K
-4.87%
jan 1, 1976
1.391 mln
+88.003K
6.75%
jan 1, 1977
1.434 mln
+42.531K
3.06%
jan 1, 1978
1.535 mln
+101.543K
7.08%
jan 1, 1979
1.55 mln
+14.956K
0.97%
jan 1, 1980
1.661 mln
+110.298K
7.11%
jan 1, 1981
1.703 mln
+42.32K
2.55%
jan 1, 1982
1.635 mln
-68.047K
-4.0%
jan 1, 1983
1.841 mln
+206.492K
12.63%
jan 1, 1984
1.808 mln
-33.609K
-1.83%
jan 1, 1985
1.7 mln
-107.59K
-5.95%
jan 1, 1986
1.693 mln
-7.391K
-0.43%
jan 1, 1987
1.762 mln
+69.436K
4.1%
jan 1, 1988
1.951 mln
+188.766K
10.71%
jan 1, 1989
1.81 mln
-140.814K
-7.22%
jan 1, 1990
1.83 mln
+20.193K
1.12%
jan 1, 1991
2.01 mln
+179.66K
9.82%
jan 1, 1992
1.959 mln
-51.367K
-2.56%
jan 1, 1993
2.142 mln
+182.788K
9.33%
jan 1, 1994
1.923 mln
-218.576K
-10.21%
jan 1, 1995
1.97 mln
+47.549K
2.47%
jan 1, 1996
2.005 mln
+34.214K
1.74%
jan 1, 1997
2.028 mln
+23.687K
1.18%
jan 1, 1998
2.245 mln
+216.369K
10.67%
jan 1, 1999
2.16 mln
-84.481K
-3.76%
jan 1, 2000
2.0 mln
-159.996K
-7.41%
jan 1, 2001
1.964 mln
-36.371K
-1.82%
jan 1, 2002
1.975 mln
+11.297K
0.58%
jan 1, 2003
2.034 mln
+58.355K
2.95%
jan 1, 2004
2.022 mln
-12.063K
-0.59%
jan 1, 2005
2.089 mln
+67.724K
3.35%
jan 1, 2006
2.169 mln
+80.205K
3.84%
jan 1, 2007
2.324 mln
+154.798K
7.14%
jan 1, 2008
2.469 mln
+145.133K
6.24%
jan 1, 2009
2.287 mln
-182.105K
-7.37%
jan 1, 2010
2.323 mln
+35.664K
1.56%
jan 1, 2011
2.368 mln
+45.076K
1.94%
jan 1, 2012
2.399 mln
+30.943K
1.31%
jan 1, 2013
2.438 mln
+38.803K
1.62%
Ranking of countries by current statistics by years


Comments: