29
/
en
AIzaSyAYiBZKx7MnpbEhh9jyipgxe19OcubqV5w
April 1, 2024
246027
South Africa
ZAF
true
2
1
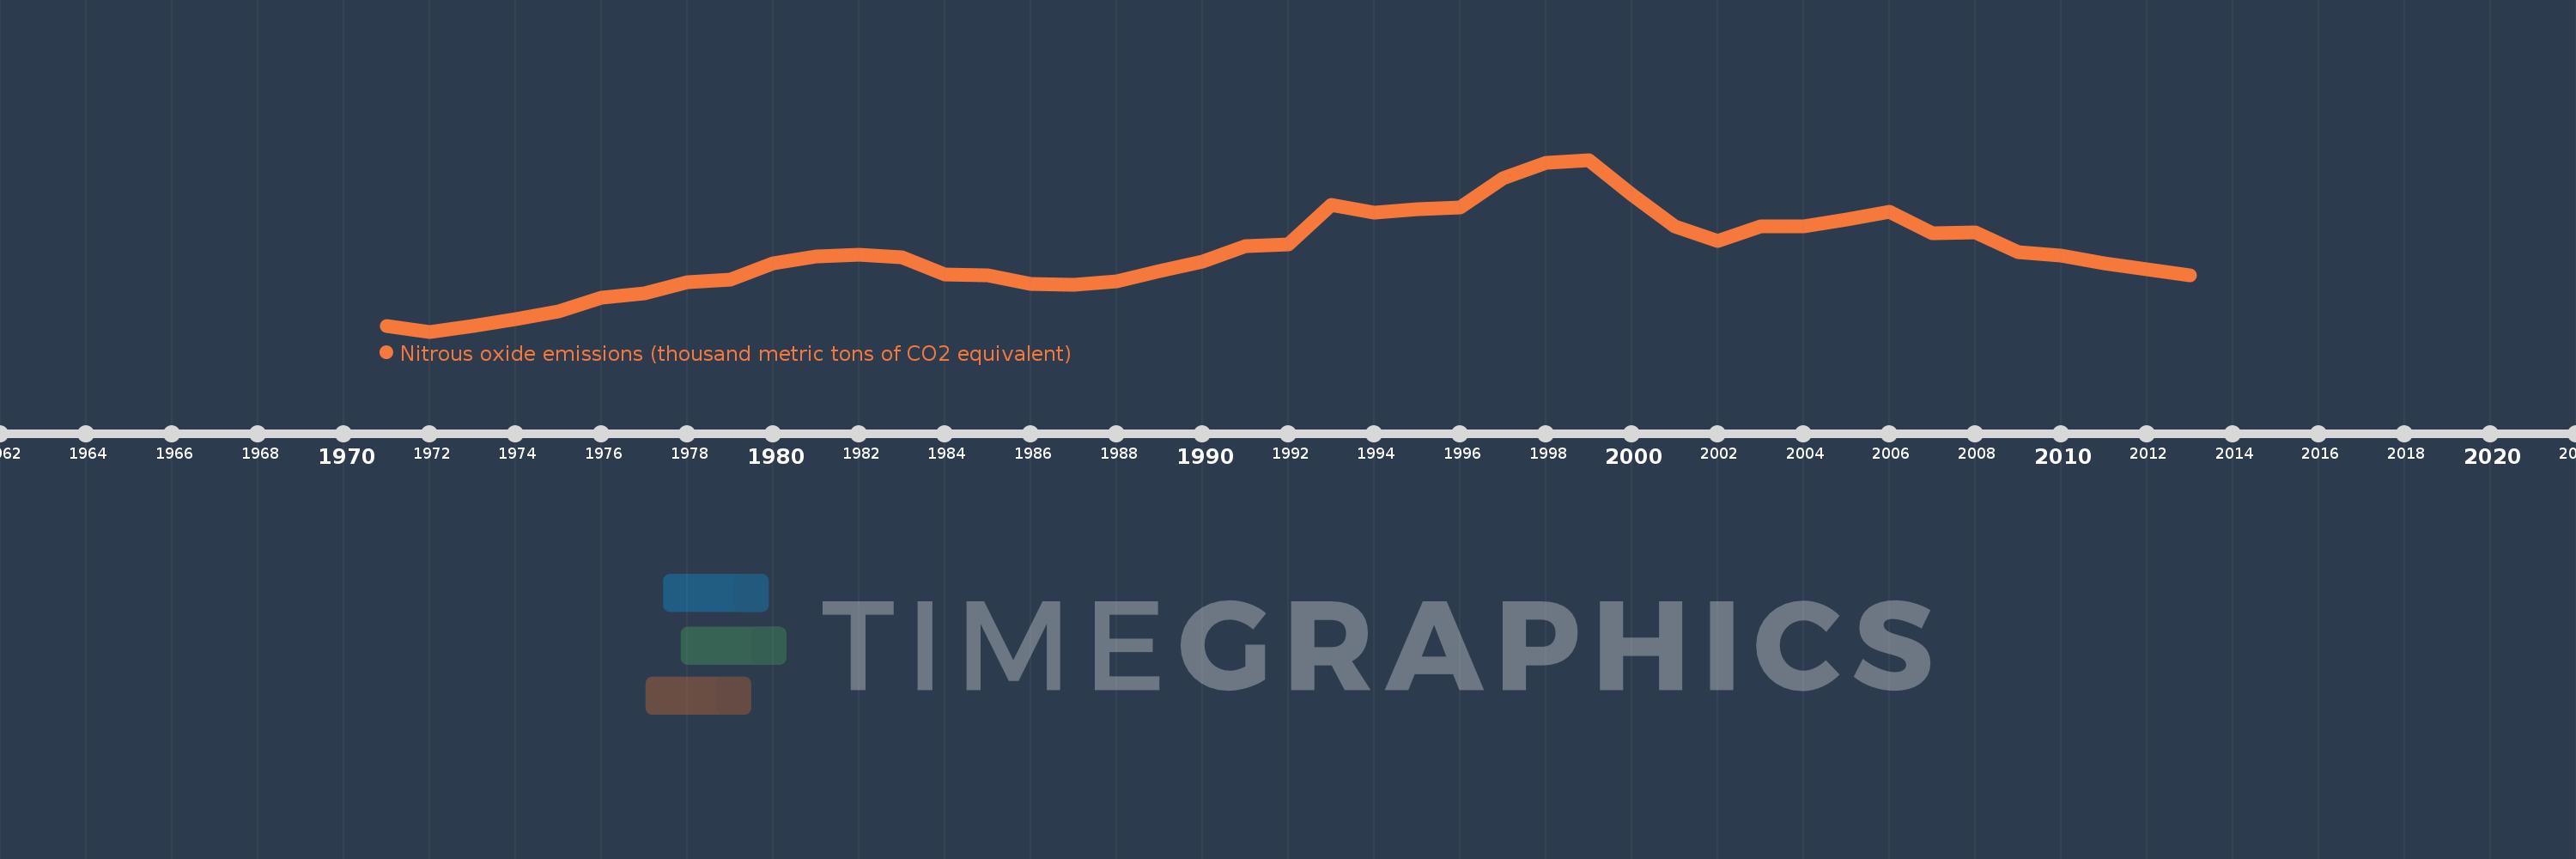
Nitrous oxide emissions (thousand metric tons of CO2 equivalent)
2013,2012,2011,2010,2009,2008,2007,2006,2005,2004,2003,2002,2001,2000,1999,1998,1997,1996,1995,1994,1993,1992,1991,1990,1989,1988,1987,1986,1985,1984,1983,1982,1981,1980,1979,1978,1977,1976,1975,1974,1973,1972,1971
This statistics in other country:
AfghanistanAlbaniaAlgeriaAmerican SamoaAndorraAngolaAntigua and BarbudaArab WorldArgentinaArmeniaArubaAustraliaAustriaAzerbaijanBahamas, TheBahrainBangladeshBarbadosBelarusBelgiumBelizeBeninBermudaBhutanBoliviaBosnia and HerzegovinaBotswanaBrazilBritish Virgin IslandsBrunei DarussalamBulgariaBurkina FasoBurundiCabo VerdeCambodiaCameroonCanadaCaribbean small statesCayman IslandsCentral African RepublicCentral Europe and the BalticsChadChileChinaColombiaComorosCongo, Dem. Rep.Congo, Rep.Costa RicaCote d'IvoireCroatiaCubaCyprusCzech RepublicDenmarkDjiboutiDominicaDominican RepublicEarly-demographic dividendEast Asia & PacificEast Asia & Pacific (excluding high income)East Asia & Pacific (IDA & IBRD countries)EcuadorEgypt, Arab Rep.El SalvadorEquatorial GuineaEritreaEstoniaEthiopiaEuro areaEurope & Central AsiaEurope & Central Asia (excluding high income)Europe & Central Asia (IDA & IBRD countries)European UnionFaroe IslandsFijiFinlandFragile and conflict affected situationsFranceFrench PolynesiaGabonGambia, TheGeorgiaGermanyGhanaGibraltarGreeceGreenlandGrenadaGuamGuatemalaGuineaGuinea-BissauGuyanaHaitiHeavily indebted poor countries (HIPC)High incomeHondurasHong Kong SAR, ChinaHungaryIBRD onlyIcelandIDA & IBRD totalIDA blendIDA onlyIDA totalIndiaIndonesiaIran, Islamic Rep.IraqIrelandIsraelItalyJamaicaJapanJordanKazakhstanKenyaKiribatiKorea, Dem. People’s Rep.Korea, Rep.KosovoKuwaitKyrgyz RepublicLao PDRLate-demographic dividendLatin America & Caribbean Latin America & Caribbean (excluding high income)Latin America & the Caribbean (IDA & IBRD countries)LatviaLeast developed countries: UN classificationLebanonLesothoLiberiaLibyaLithuaniaLow & middle incomeLow incomeLower middle incomeLuxembourgMacao SAR, ChinaMacedonia, FYRMadagascarMalawiMalaysiaMaldivesMaliMaltaMarshall IslandsMauritaniaMauritiusMexicoMicronesia, Fed. Sts.Middle East & North AfricaMiddle East & North Africa (excluding high income)Middle East & North Africa (IDA & IBRD countries)Middle incomeMoldovaMongoliaMontenegroMoroccoMozambiqueMyanmarNamibiaNauruNepalNetherlandsNew CaledoniaNew ZealandNicaraguaNigerNigeriaNorth AmericaNorthern Mariana IslandsNorwayOECD membersOmanOther small statesPacific island small statesPakistanPalauPanamaPapua New GuineaParaguayPeruPhilippinesPolandPortugalPost-demographic dividendPre-demographic dividendPuerto RicoQatarRomaniaRussian FederationRwandaSamoaSao Tome and PrincipeSaudi ArabiaSenegalSerbiaSeychellesSierra LeoneSingaporeSlovak RepublicSloveniaSmall statesSolomon IslandsSomaliaSouth AfricaSouth AsiaSouth Asia (IDA & IBRD)SpainSri LankaSt. Kitts and NevisSt. LuciaSt. Vincent and the GrenadinesSub-Saharan Africa Sub-Saharan Africa (excluding high income)Sub-Saharan Africa (IDA & IBRD countries)SudanSurinameSwazilandSwedenSwitzerlandSyrian Arab RepublicTajikistanTanzaniaThailandTimor-LesteTogoTongaTrinidad and TobagoTunisiaTurkeyTurkmenistanTurks and Caicos IslandsTuvaluUgandaUkraineUnited Arab EmiratesUnited KingdomUnited StatesUpper middle incomeUruguayUzbekistanVanuatuVenezuela, RBVietnamVirgin Islands (U.S.)WorldYemen, Rep.ZambiaZimbabwe Timeline:
This timeline shows a graph from 1971 to 2013 of South Africa. No data until 1970. Number of actual observations by date: 43.
Source name:
World Development Indicators
Source organization:
European Commission, Joint Research Centre (JRC)/Netherlands Environmental Assessment Agency (PBL). Emission Database for Global Atmospheric Research (EDGAR): http://edgar.jrc.ec.europa.eu/
Categories, topics:
Climate Change, Environment
Last updated:
apr 23, 2017
Indicators value changes by year
Minimum:
17.882K
jan 1, 1972
Maximum:
27.904K
jan 1, 1999
At the date of observation
Value
Absolute change
Change from previous value
jan 1, 1971
18.201K
+18.201K
0.0%
jan 1, 1972
17.882K
-318.99
-1.75%
jan 1, 1973
18.229K
+347.882
1.95%
jan 1, 1974
18.616K
+386.818
2.12%
jan 1, 1975
19.065K
+448.477
2.41%
jan 1, 1976
19.859K
+794.747
4.17%
jan 1, 1977
20.129K
+269.669
1.36%
jan 1, 1978
20.776K
+646.443
3.21%
jan 1, 1979
20.929K
+152.954
0.74%
jan 1, 1980
21.858K
+929.132
4.44%
jan 1, 1981
22.287K
+429.35
1.96%
jan 1, 1982
22.391K
+103.54
0.46%
jan 1, 1983
22.221K
-169.57
-0.76%
jan 1, 1984
21.239K
-982.266
-4.42%
jan 1, 1985
21.175K
-63.705
-0.3%
jan 1, 1986
20.676K
-499.348
-2.36%
jan 1, 1987
20.613K
-62.682
-0.3%
jan 1, 1988
20.807K
+194.122
0.94%
jan 1, 1989
21.4K
+593.216
2.85%
jan 1, 1990
21.945K
+544.546
2.54%
jan 1, 1991
22.885K
+940.013
4.28%
jan 1, 1992
22.992K
+107.384
0.47%
jan 1, 1993
25.287K
+2.295K
9.98%
jan 1, 1994
24.801K
-486.266
-1.92%
jan 1, 1995
25.001K
+200.198
0.81%
jan 1, 1996
25.135K
+134.261
0.54%
jan 1, 1997
26.85K
+1.715K
6.82%
jan 1, 1998
27.731K
+880.059
3.28%
jan 1, 1999
27.904K
+173.073
0.62%
jan 1, 2000
25.874K
-2.029K
-7.27%
jan 1, 2001
24.036K
-1.838K
-7.1%
jan 1, 2002
23.16K
-875.812
-3.64%
jan 1, 2003
24.01K
+849.834
3.67%
jan 1, 2004
24.02K
+9.951
0.04%
jan 1, 2005
24.405K
+384.865
1.6%
jan 1, 2006
24.859K
+453.995
1.86%
jan 1, 2007
23.595K
-1.264K
-5.08%
jan 1, 2008
23.662K
+67.425
0.29%
jan 1, 2009
22.515K
-1.147K
-4.85%
jan 1, 2010
22.318K
-197.594
-0.88%
jan 1, 2011
21.87K
-447.578
-2.01%
jan 1, 2012
21.509K
-360.859
-1.65%
jan 1, 2013
21.149K
-360.859
-1.68%
Ranking of countries by current statistics by years


Comments: