29
/
en
AIzaSyAYiBZKx7MnpbEhh9jyipgxe19OcubqV5w
April 1, 2024
233945
Sao Tome and Principe
STP
true
2
1
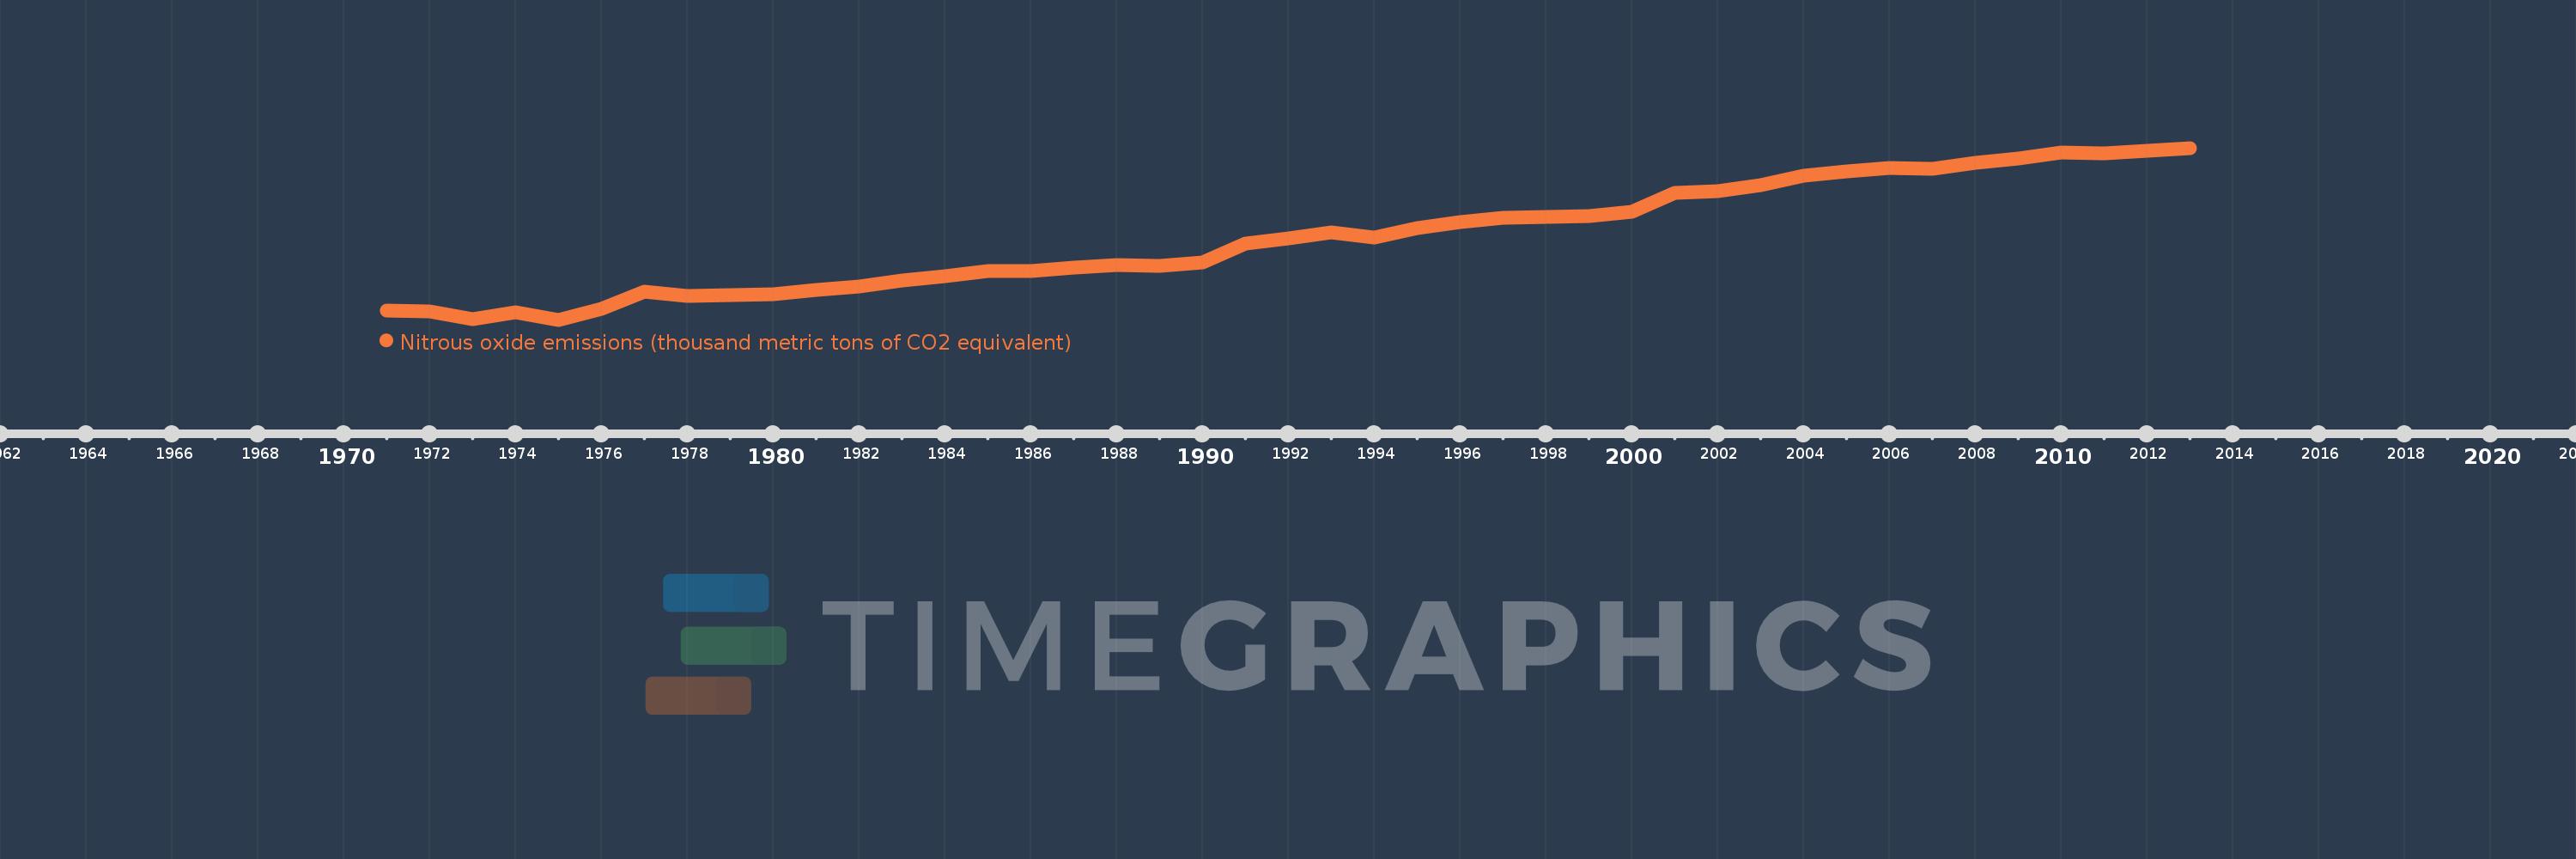
Nitrous oxide emissions (thousand metric tons of CO2 equivalent)
2013,2012,2011,2010,2009,2008,2007,2006,2005,2004,2003,2002,2001,2000,1999,1998,1997,1996,1995,1994,1993,1992,1991,1990,1989,1988,1987,1986,1985,1984,1983,1982,1981,1980,1979,1978,1977,1976,1975,1974,1973,1972,1971
This statistics in other country:
AfghanistanAlbaniaAlgeriaAmerican SamoaAndorraAngolaAntigua and BarbudaArab WorldArgentinaArmeniaArubaAustraliaAustriaAzerbaijanBahamas, TheBahrainBangladeshBarbadosBelarusBelgiumBelizeBeninBermudaBhutanBoliviaBosnia and HerzegovinaBotswanaBrazilBritish Virgin IslandsBrunei DarussalamBulgariaBurkina FasoBurundiCabo VerdeCambodiaCameroonCanadaCaribbean small statesCayman IslandsCentral African RepublicCentral Europe and the BalticsChadChileChinaColombiaComorosCongo, Dem. Rep.Congo, Rep.Costa RicaCote d'IvoireCroatiaCubaCyprusCzech RepublicDenmarkDjiboutiDominicaDominican RepublicEarly-demographic dividendEast Asia & PacificEast Asia & Pacific (excluding high income)East Asia & Pacific (IDA & IBRD countries)EcuadorEgypt, Arab Rep.El SalvadorEquatorial GuineaEritreaEstoniaEthiopiaEuro areaEurope & Central AsiaEurope & Central Asia (excluding high income)Europe & Central Asia (IDA & IBRD countries)European UnionFaroe IslandsFijiFinlandFragile and conflict affected situationsFranceFrench PolynesiaGabonGambia, TheGeorgiaGermanyGhanaGibraltarGreeceGreenlandGrenadaGuamGuatemalaGuineaGuinea-BissauGuyanaHaitiHeavily indebted poor countries (HIPC)High incomeHondurasHong Kong SAR, ChinaHungaryIBRD onlyIcelandIDA & IBRD totalIDA blendIDA onlyIDA totalIndiaIndonesiaIran, Islamic Rep.IraqIrelandIsraelItalyJamaicaJapanJordanKazakhstanKenyaKiribatiKorea, Dem. People’s Rep.Korea, Rep.KosovoKuwaitKyrgyz RepublicLao PDRLate-demographic dividendLatin America & Caribbean Latin America & Caribbean (excluding high income)Latin America & the Caribbean (IDA & IBRD countries)LatviaLeast developed countries: UN classificationLebanonLesothoLiberiaLibyaLithuaniaLow & middle incomeLow incomeLower middle incomeLuxembourgMacao SAR, ChinaMacedonia, FYRMadagascarMalawiMalaysiaMaldivesMaliMaltaMarshall IslandsMauritaniaMauritiusMexicoMicronesia, Fed. Sts.Middle East & North AfricaMiddle East & North Africa (excluding high income)Middle East & North Africa (IDA & IBRD countries)Middle incomeMoldovaMongoliaMontenegroMoroccoMozambiqueMyanmarNamibiaNauruNepalNetherlandsNew CaledoniaNew ZealandNicaraguaNigerNigeriaNorth AmericaNorthern Mariana IslandsNorwayOECD membersOmanOther small statesPacific island small statesPakistanPalauPanamaPapua New GuineaParaguayPeruPhilippinesPolandPortugalPost-demographic dividendPre-demographic dividendPuerto RicoQatarRomaniaRussian FederationRwandaSamoaSao Tome and PrincipeSaudi ArabiaSenegalSerbiaSeychellesSierra LeoneSingaporeSlovak RepublicSloveniaSmall statesSolomon IslandsSomaliaSouth AfricaSouth AsiaSouth Asia (IDA & IBRD)SpainSri LankaSt. Kitts and NevisSt. LuciaSt. Vincent and the GrenadinesSub-Saharan Africa Sub-Saharan Africa (excluding high income)Sub-Saharan Africa (IDA & IBRD countries)SudanSurinameSwazilandSwedenSwitzerlandSyrian Arab RepublicTajikistanTanzaniaThailandTimor-LesteTogoTongaTrinidad and TobagoTunisiaTurkeyTurkmenistanTurks and Caicos IslandsTuvaluUgandaUkraineUnited Arab EmiratesUnited KingdomUnited StatesUpper middle incomeUruguayUzbekistanVanuatuVenezuela, RBVietnamVirgin Islands (U.S.)WorldYemen, Rep.ZambiaZimbabwe Timeline:
This timeline shows a graph from 1971 to 2013 of Sao Tome and Principe. No data until 1970. Number of actual observations by date: 43.
Source name:
World Development Indicators
Source organization:
European Commission, Joint Research Centre (JRC)/Netherlands Environmental Assessment Agency (PBL). Emission Database for Global Atmospheric Research (EDGAR): http://edgar.jrc.ec.europa.eu/
Categories, topics:
Climate Change, Environment
Last updated:
apr 23, 2017
Indicators value changes by year
At the date of observation
Value
Absolute change
Change from previous value
jan 1, 1971
3.763
+3.763
0.0%
jan 1, 1972
3.726
-0.037
-0.98%
jan 1, 1973
3.452
-0.274
-7.34%
jan 1, 1974
3.689
+0.237
6.86%
jan 1, 1975
3.418
-0.272
-7.37%
jan 1, 1976
3.811
+0.393
11.5%
jan 1, 1977
4.434
+0.623
16.36%
jan 1, 1978
4.293
-0.141
-3.18%
jan 1, 1979
4.308
+0.015
0.36%
jan 1, 1980
4.338
+0.03
0.69%
jan 1, 1981
4.502
+0.164
3.79%
jan 1, 1982
4.646
+0.144
3.19%
jan 1, 1983
4.839
+0.193
4.16%
jan 1, 1984
5.008
+0.169
3.49%
jan 1, 1985
5.19
+0.182
3.64%
jan 1, 1986
5.198
+0.008
0.16%
jan 1, 1987
5.31
+0.112
2.15%
jan 1, 1988
5.413
+0.103
1.94%
jan 1, 1989
5.381
-0.033
-0.6%
jan 1, 1990
5.505
+0.124
2.3%
jan 1, 1991
6.202
+0.697
12.66%
jan 1, 1992
6.389
+0.187
3.02%
jan 1, 1993
6.623
+0.234
3.67%
jan 1, 1994
6.431
-0.193
-2.91%
jan 1, 1995
6.757
+0.326
5.07%
jan 1, 1996
6.972
+0.215
3.18%
jan 1, 1997
7.143
+0.172
2.46%
jan 1, 1998
7.184
+0.041
0.57%
jan 1, 1999
7.214
+0.03
0.42%
jan 1, 2000
7.363
+0.149
2.07%
jan 1, 2001
8.048
+0.685
9.3%
jan 1, 2002
8.125
+0.077
0.96%
jan 1, 2003
8.325
+0.2
2.46%
jan 1, 2004
8.681
+0.355
4.27%
jan 1, 2005
8.841
+0.16
1.85%
jan 1, 2006
8.971
+0.13
1.47%
jan 1, 2007
8.944
-0.028
-0.31%
jan 1, 2008
9.153
+0.21
2.34%
jan 1, 2009
9.315
+0.161
1.76%
jan 1, 2010
9.514
+0.199
2.14%
jan 1, 2011
9.506
-0.008
-0.08%
jan 1, 2012
9.601
+0.095
1.0%
jan 1, 2013
9.696
+0.095
0.99%
Ranking of countries by current statistics by years


Comments: