29
/
en
AIzaSyAYiBZKx7MnpbEhh9jyipgxe19OcubqV5w
April 1, 2024
203334
Mozambique
MOZ
true
2
1
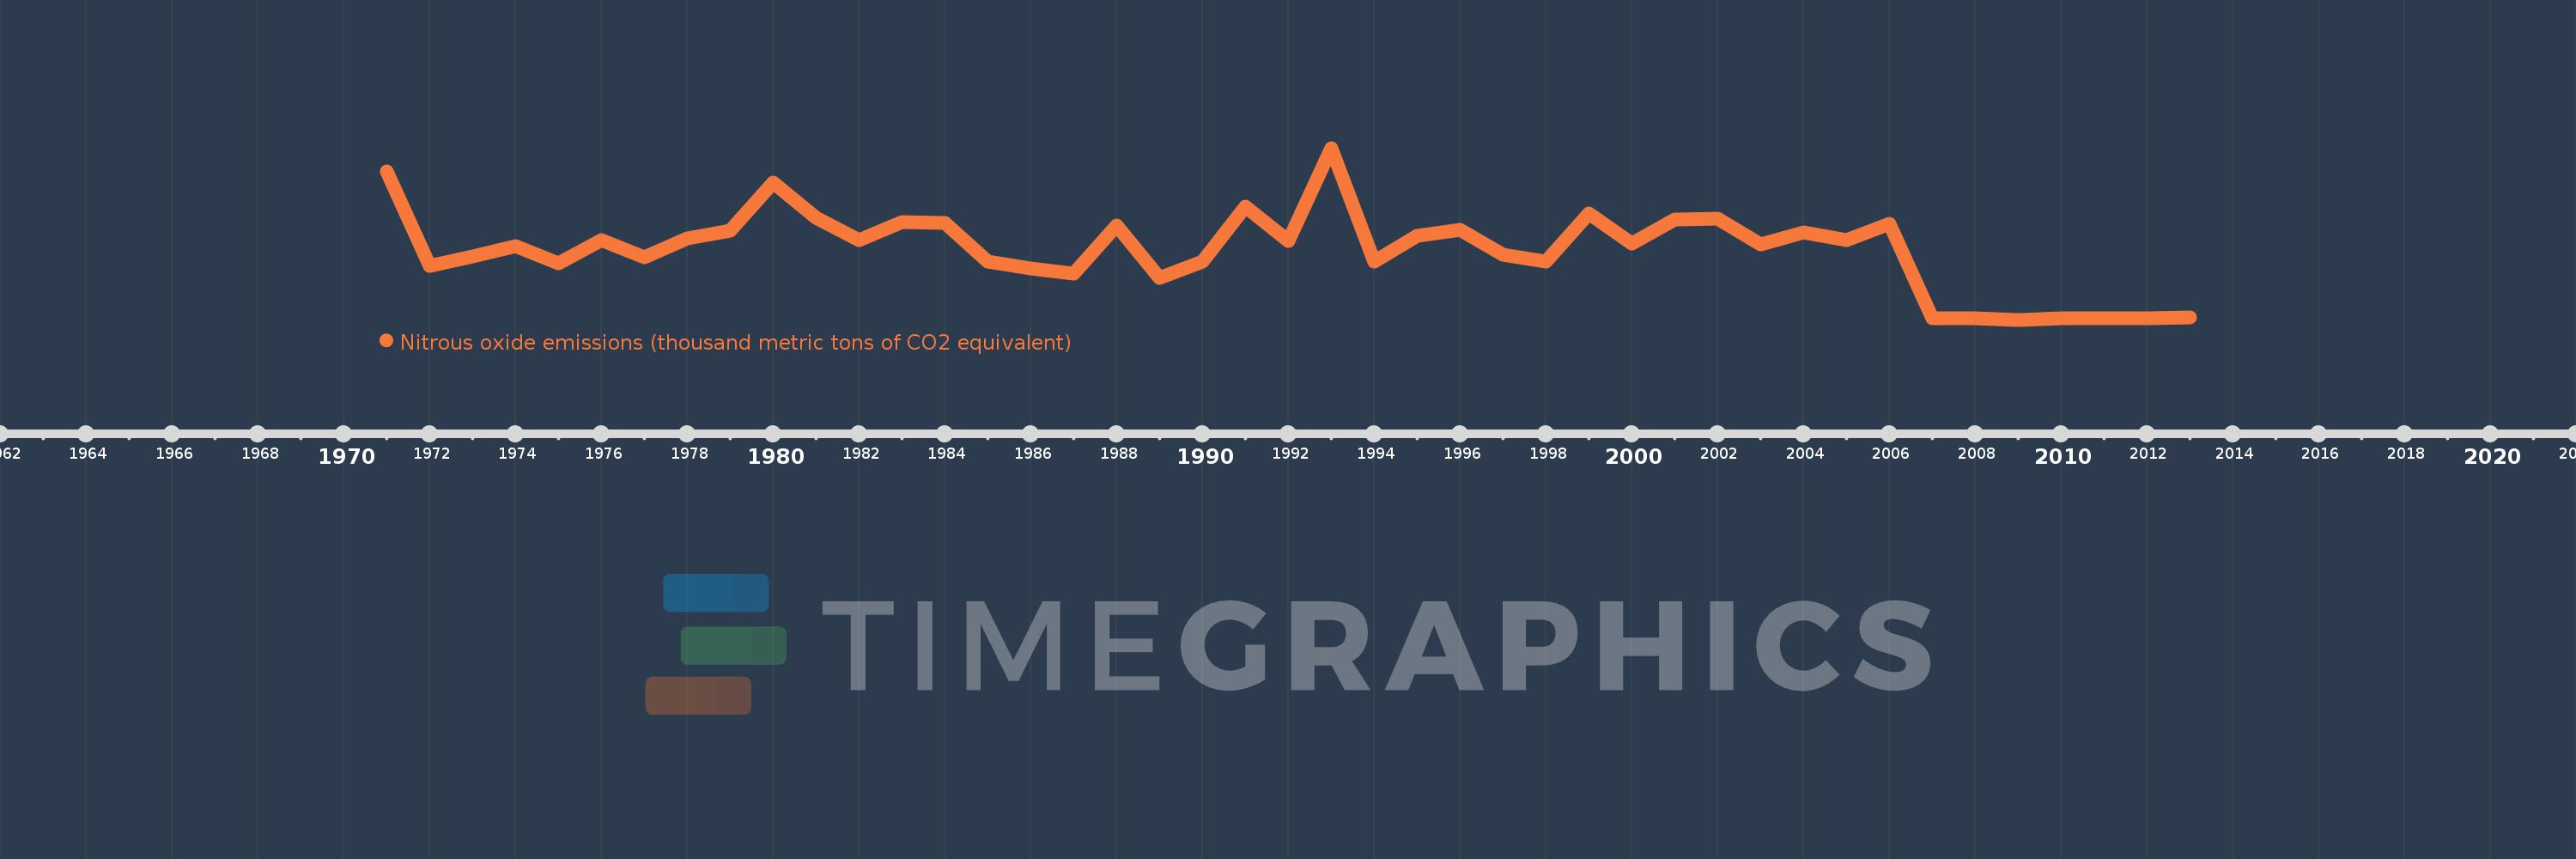
Nitrous oxide emissions (thousand metric tons of CO2 equivalent)
2013,2012,2011,2010,2009,2008,2007,2006,2005,2004,2003,2002,2001,2000,1999,1998,1997,1996,1995,1994,1993,1992,1991,1990,1989,1988,1987,1986,1985,1984,1983,1982,1981,1980,1979,1978,1977,1976,1975,1974,1973,1972,1971
This statistics in other country:
AfghanistanAlbaniaAlgeriaAmerican SamoaAndorraAngolaAntigua and BarbudaArab WorldArgentinaArmeniaArubaAustraliaAustriaAzerbaijanBahamas, TheBahrainBangladeshBarbadosBelarusBelgiumBelizeBeninBermudaBhutanBoliviaBosnia and HerzegovinaBotswanaBrazilBritish Virgin IslandsBrunei DarussalamBulgariaBurkina FasoBurundiCabo VerdeCambodiaCameroonCanadaCaribbean small statesCayman IslandsCentral African RepublicCentral Europe and the BalticsChadChileChinaColombiaComorosCongo, Dem. Rep.Congo, Rep.Costa RicaCote d'IvoireCroatiaCubaCyprusCzech RepublicDenmarkDjiboutiDominicaDominican RepublicEarly-demographic dividendEast Asia & PacificEast Asia & Pacific (excluding high income)East Asia & Pacific (IDA & IBRD countries)EcuadorEgypt, Arab Rep.El SalvadorEquatorial GuineaEritreaEstoniaEthiopiaEuro areaEurope & Central AsiaEurope & Central Asia (excluding high income)Europe & Central Asia (IDA & IBRD countries)European UnionFaroe IslandsFijiFinlandFragile and conflict affected situationsFranceFrench PolynesiaGabonGambia, TheGeorgiaGermanyGhanaGibraltarGreeceGreenlandGrenadaGuamGuatemalaGuineaGuinea-BissauGuyanaHaitiHeavily indebted poor countries (HIPC)High incomeHondurasHong Kong SAR, ChinaHungaryIBRD onlyIcelandIDA & IBRD totalIDA blendIDA onlyIDA totalIndiaIndonesiaIran, Islamic Rep.IraqIrelandIsraelItalyJamaicaJapanJordanKazakhstanKenyaKiribatiKorea, Dem. People’s Rep.Korea, Rep.KosovoKuwaitKyrgyz RepublicLao PDRLate-demographic dividendLatin America & Caribbean Latin America & Caribbean (excluding high income)Latin America & the Caribbean (IDA & IBRD countries)LatviaLeast developed countries: UN classificationLebanonLesothoLiberiaLibyaLithuaniaLow & middle incomeLow incomeLower middle incomeLuxembourgMacao SAR, ChinaMacedonia, FYRMadagascarMalawiMalaysiaMaldivesMaliMaltaMarshall IslandsMauritaniaMauritiusMexicoMicronesia, Fed. Sts.Middle East & North AfricaMiddle East & North Africa (excluding high income)Middle East & North Africa (IDA & IBRD countries)Middle incomeMoldovaMongoliaMontenegroMoroccoMozambiqueMyanmarNamibiaNauruNepalNetherlandsNew CaledoniaNew ZealandNicaraguaNigerNigeriaNorth AmericaNorthern Mariana IslandsNorwayOECD membersOmanOther small statesPacific island small statesPakistanPalauPanamaPapua New GuineaParaguayPeruPhilippinesPolandPortugalPost-demographic dividendPre-demographic dividendPuerto RicoQatarRomaniaRussian FederationRwandaSamoaSao Tome and PrincipeSaudi ArabiaSenegalSerbiaSeychellesSierra LeoneSingaporeSlovak RepublicSloveniaSmall statesSolomon IslandsSomaliaSouth AfricaSouth AsiaSouth Asia (IDA & IBRD)SpainSri LankaSt. Kitts and NevisSt. LuciaSt. Vincent and the GrenadinesSub-Saharan Africa Sub-Saharan Africa (excluding high income)Sub-Saharan Africa (IDA & IBRD countries)SudanSurinameSwazilandSwedenSwitzerlandSyrian Arab RepublicTajikistanTanzaniaThailandTimor-LesteTogoTongaTrinidad and TobagoTunisiaTurkeyTurkmenistanTurks and Caicos IslandsTuvaluUgandaUkraineUnited Arab EmiratesUnited KingdomUnited StatesUpper middle incomeUruguayUzbekistanVanuatuVenezuela, RBVietnamVirgin Islands (U.S.)WorldYemen, Rep.ZambiaZimbabwe Timeline:
This timeline shows a graph from 1971 to 2013 of Mozambique. No data until 1970. Number of actual observations by date: 43.
Source name:
World Development Indicators
Source organization:
European Commission, Joint Research Centre (JRC)/Netherlands Environmental Assessment Agency (PBL). Emission Database for Global Atmospheric Research (EDGAR): http://edgar.jrc.ec.europa.eu/
Categories, topics:
Climate Change, Environment
Last updated:
apr 23, 2017
Indicators value changes by year
Minimum:
2.119K
jan 1, 2009
Maximum:
14.995K
jan 1, 1993
At the date of observation
Value
Absolute change
Change from previous value
jan 1, 1971
13.242K
+13.242K
0.0%
jan 1, 1972
6.177K
-7.065K
-53.35%
jan 1, 1973
6.868K
+691.858
11.2%
jan 1, 1974
7.658K
+789.663
11.5%
jan 1, 1975
6.338K
-1.32K
-17.24%
jan 1, 1976
8.08K
+1.742K
27.49%
jan 1, 1977
6.827K
-1.253K
-15.51%
jan 1, 1978
8.248K
+1.421K
20.81%
jan 1, 1979
8.791K
+542.81
6.58%
jan 1, 1980
12.381K
+3.59K
40.84%
jan 1, 1981
9.754K
-2.627K
-21.22%
jan 1, 1982
8.073K
-1.681K
-17.24%
jan 1, 1983
9.467K
+1.395K
17.28%
jan 1, 1984
9.379K
-88.815
-0.94%
jan 1, 1985
6.509K
-2.87K
-30.6%
jan 1, 1986
5.951K
-558.031
-8.57%
jan 1, 1987
5.597K
-353.183
-5.94%
jan 1, 1988
9.2K
+3.602K
64.36%
jan 1, 1989
5.276K
-3.923K
-42.65%
jan 1, 1990
6.481K
+1.204K
22.82%
jan 1, 1991
10.619K
+4.139K
63.86%
jan 1, 1992
8.049K
-2.57K
-24.2%
jan 1, 1993
14.995K
+6.946K
86.29%
jan 1, 1994
6.502K
-8.493K
-56.64%
jan 1, 1995
8.432K
+1.929K
29.67%
jan 1, 1996
8.831K
+398.908
4.73%
jan 1, 1997
6.975K
-1.855K
-21.01%
jan 1, 1998
6.463K
-512.027
-7.34%
jan 1, 1999
10.081K
+3.617K
55.97%
jan 1, 2000
7.829K
-2.252K
-22.34%
jan 1, 2001
9.608K
+1.779K
22.73%
jan 1, 2002
9.671K
+62.527
0.65%
jan 1, 2003
7.782K
-1.889K
-19.54%
jan 1, 2004
8.696K
+913.88
11.74%
jan 1, 2005
8.072K
-623.441
-7.17%
jan 1, 2006
9.322K
+1.25K
15.48%
jan 1, 2007
2.206K
-7.116K
-76.34%
jan 1, 2008
2.201K
-5.007
-0.23%
jan 1, 2009
2.119K
-81.223
-3.69%
jan 1, 2010
2.197K
+77.922
3.68%
jan 1, 2011
2.217K
+19.642
0.89%
jan 1, 2012
2.239K
+22.17
1.0%
jan 1, 2013
2.261K
+22.17
0.99%
Ranking of countries by current statistics by years


Comments: