29
/
en
AIzaSyAYiBZKx7MnpbEhh9jyipgxe19OcubqV5w
April 1, 2024
137129
Gambia, The
GMB
true
2
1
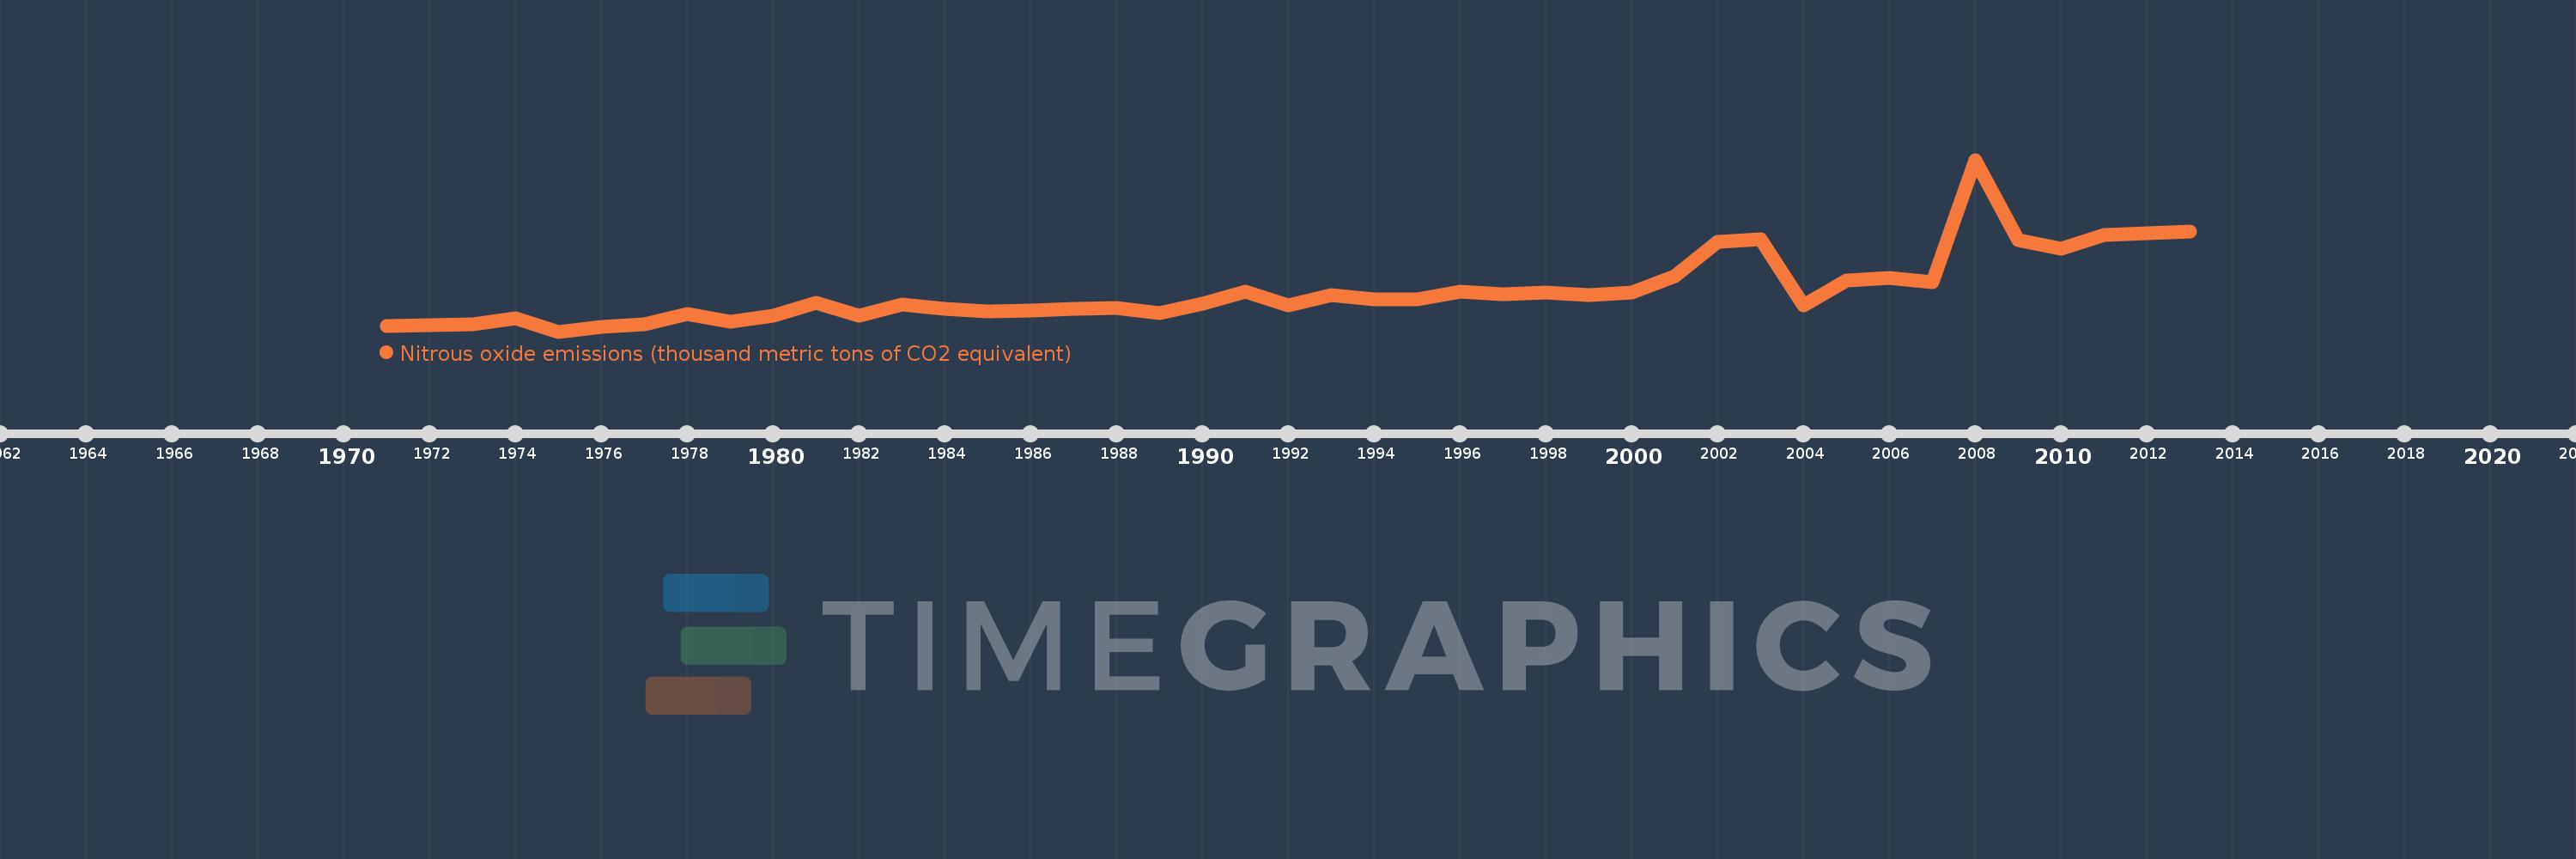
Nitrous oxide emissions (thousand metric tons of CO2 equivalent)
2013,2012,2011,2010,2009,2008,2007,2006,2005,2004,2003,2002,2001,2000,1999,1998,1997,1996,1995,1994,1993,1992,1991,1990,1989,1988,1987,1986,1985,1984,1983,1982,1981,1980,1979,1978,1977,1976,1975,1974,1973,1972,1971
This statistics in other country:
AfghanistanAlbaniaAlgeriaAmerican SamoaAndorraAngolaAntigua and BarbudaArab WorldArgentinaArmeniaArubaAustraliaAustriaAzerbaijanBahamas, TheBahrainBangladeshBarbadosBelarusBelgiumBelizeBeninBermudaBhutanBoliviaBosnia and HerzegovinaBotswanaBrazilBritish Virgin IslandsBrunei DarussalamBulgariaBurkina FasoBurundiCabo VerdeCambodiaCameroonCanadaCaribbean small statesCayman IslandsCentral African RepublicCentral Europe and the BalticsChadChileChinaColombiaComorosCongo, Dem. Rep.Congo, Rep.Costa RicaCote d'IvoireCroatiaCubaCyprusCzech RepublicDenmarkDjiboutiDominicaDominican RepublicEarly-demographic dividendEast Asia & PacificEast Asia & Pacific (excluding high income)East Asia & Pacific (IDA & IBRD countries)EcuadorEgypt, Arab Rep.El SalvadorEquatorial GuineaEritreaEstoniaEthiopiaEuro areaEurope & Central AsiaEurope & Central Asia (excluding high income)Europe & Central Asia (IDA & IBRD countries)European UnionFaroe IslandsFijiFinlandFragile and conflict affected situationsFranceFrench PolynesiaGabonGambia, TheGeorgiaGermanyGhanaGibraltarGreeceGreenlandGrenadaGuamGuatemalaGuineaGuinea-BissauGuyanaHaitiHeavily indebted poor countries (HIPC)High incomeHondurasHong Kong SAR, ChinaHungaryIBRD onlyIcelandIDA & IBRD totalIDA blendIDA onlyIDA totalIndiaIndonesiaIran, Islamic Rep.IraqIrelandIsraelItalyJamaicaJapanJordanKazakhstanKenyaKiribatiKorea, Dem. People’s Rep.Korea, Rep.KosovoKuwaitKyrgyz RepublicLao PDRLate-demographic dividendLatin America & Caribbean Latin America & Caribbean (excluding high income)Latin America & the Caribbean (IDA & IBRD countries)LatviaLeast developed countries: UN classificationLebanonLesothoLiberiaLibyaLithuaniaLow & middle incomeLow incomeLower middle incomeLuxembourgMacao SAR, ChinaMacedonia, FYRMadagascarMalawiMalaysiaMaldivesMaliMaltaMarshall IslandsMauritaniaMauritiusMexicoMicronesia, Fed. Sts.Middle East & North AfricaMiddle East & North Africa (excluding high income)Middle East & North Africa (IDA & IBRD countries)Middle incomeMoldovaMongoliaMontenegroMoroccoMozambiqueMyanmarNamibiaNauruNepalNetherlandsNew CaledoniaNew ZealandNicaraguaNigerNigeriaNorth AmericaNorthern Mariana IslandsNorwayOECD membersOmanOther small statesPacific island small statesPakistanPalauPanamaPapua New GuineaParaguayPeruPhilippinesPolandPortugalPost-demographic dividendPre-demographic dividendPuerto RicoQatarRomaniaRussian FederationRwandaSamoaSao Tome and PrincipeSaudi ArabiaSenegalSerbiaSeychellesSierra LeoneSingaporeSlovak RepublicSloveniaSmall statesSolomon IslandsSomaliaSouth AfricaSouth AsiaSouth Asia (IDA & IBRD)SpainSri LankaSt. Kitts and NevisSt. LuciaSt. Vincent and the GrenadinesSub-Saharan Africa Sub-Saharan Africa (excluding high income)Sub-Saharan Africa (IDA & IBRD countries)SudanSurinameSwazilandSwedenSwitzerlandSyrian Arab RepublicTajikistanTanzaniaThailandTimor-LesteTogoTongaTrinidad and TobagoTunisiaTurkeyTurkmenistanTurks and Caicos IslandsTuvaluUgandaUkraineUnited Arab EmiratesUnited KingdomUnited StatesUpper middle incomeUruguayUzbekistanVanuatuVenezuela, RBVietnamVirgin Islands (U.S.)WorldYemen, Rep.ZambiaZimbabwe Timeline:
This timeline shows a graph from 1971 to 2013 of Gambia, The. No data until 1970. Number of actual observations by date: 43.
Source name:
World Development Indicators
Source organization:
European Commission, Joint Research Centre (JRC)/Netherlands Environmental Assessment Agency (PBL). Emission Database for Global Atmospheric Research (EDGAR): http://edgar.jrc.ec.europa.eu/
Categories, topics:
Climate Change, Environment
Last updated:
apr 23, 2017
Indicators value changes by year
Minimum:
217.142
jan 1, 1975
Maximum:
703.976
jan 1, 2008
At the date of observation
Value
Absolute change
Change from previous value
jan 1, 1971
234.074
+234.074
0.0%
jan 1, 1972
235.665
+1.592
0.68%
jan 1, 1973
238.485
+2.819
1.2%
jan 1, 1974
253.797
+15.312
6.42%
jan 1, 1975
217.142
-36.655
-14.44%
jan 1, 1976
229.541
+12.399
5.71%
jan 1, 1977
237.563
+8.022
3.5%
jan 1, 1978
267.33
+29.767
12.53%
jan 1, 1979
245.078
-22.252
-8.32%
jan 1, 1980
261.196
+16.118
6.58%
jan 1, 1981
298.391
+37.195
14.24%
jan 1, 1982
262.8
-35.591
-11.93%
jan 1, 1983
293.898
+31.098
11.83%
jan 1, 1984
280.558
-13.34
-4.54%
jan 1, 1985
274.834
-5.724
-2.04%
jan 1, 1986
275.608
+0.774
0.28%
jan 1, 1987
282.139
+6.532
2.37%
jan 1, 1988
283.607
+1.467
0.52%
jan 1, 1989
269.11
-14.497
-5.11%
jan 1, 1990
295.299
+26.189
9.73%
jan 1, 1991
331.158
+35.858
12.14%
jan 1, 1992
292.221
-38.937
-11.76%
jan 1, 1993
320.971
+28.75
9.84%
jan 1, 1994
307.403
-13.568
-4.23%
jan 1, 1995
307.32
-0.082
-0.03%
jan 1, 1996
329.477
+22.157
7.21%
jan 1, 1997
323.377
-6.101
-1.85%
jan 1, 1998
328.733
+5.357
1.66%
jan 1, 1999
319.576
-9.157
-2.79%
jan 1, 2000
327.596
+8.02
2.51%
jan 1, 2001
374.911
+47.315
14.44%
jan 1, 2002
471.987
+97.076
25.89%
jan 1, 2003
479.508
+7.521
1.59%
jan 1, 2004
291.903
-187.605
-39.12%
jan 1, 2005
362.843
+70.94
24.3%
jan 1, 2006
368.776
+5.933
1.64%
jan 1, 2007
357.945
-10.831
-2.94%
jan 1, 2008
703.976
+346.031
96.67%
jan 1, 2009
475.515
-228.461
-32.45%
jan 1, 2010
452.941
-22.574
-4.75%
jan 1, 2011
490.017
+37.076
8.19%
jan 1, 2012
494.917
+4.9
1.0%
jan 1, 2013
499.817
+4.9
0.99%
Ranking of countries by current statistics by years


Comments: