29
/
en
AIzaSyAYiBZKx7MnpbEhh9jyipgxe19OcubqV5w
April 1, 2024
272683
Uganda
UGA
true
2
1
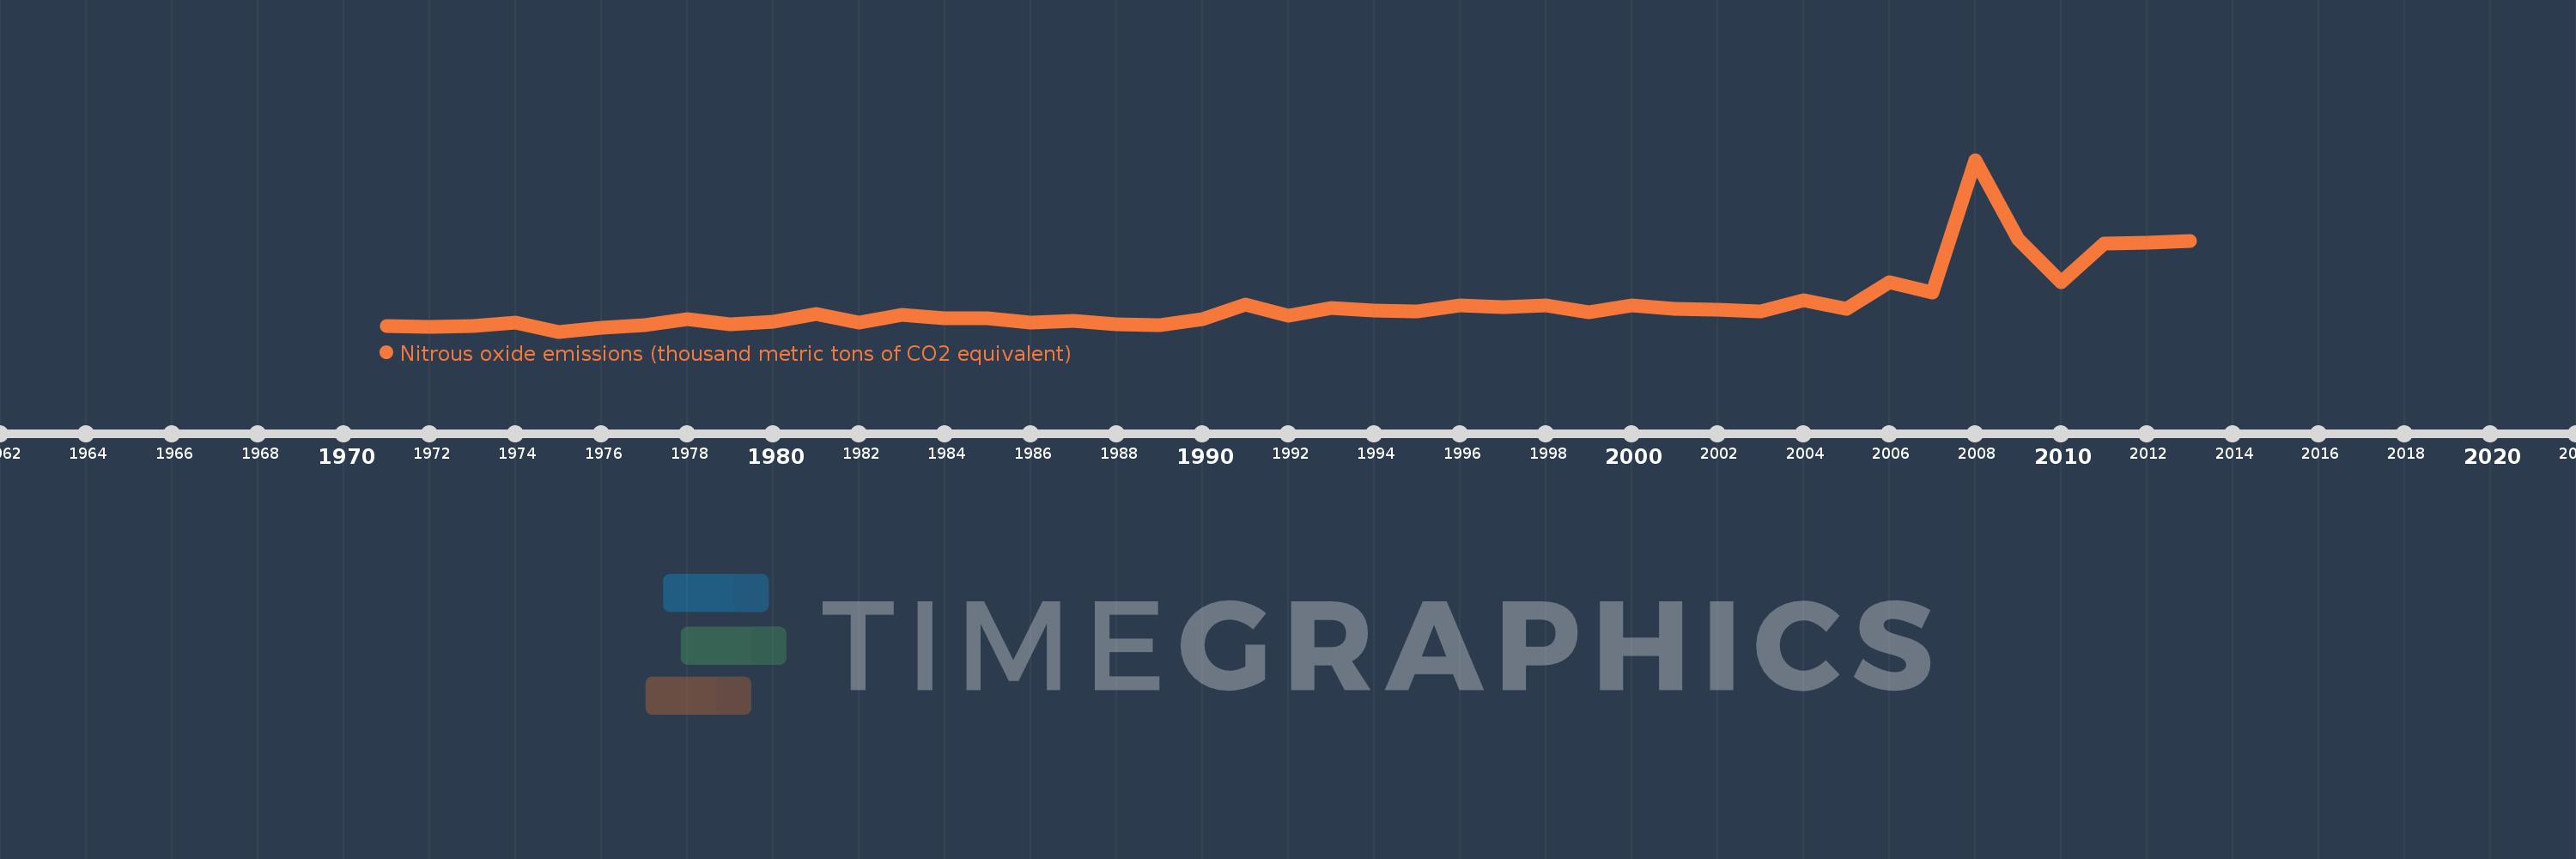
Nitrous oxide emissions (thousand metric tons of CO2 equivalent)
2013,2012,2011,2010,2009,2008,2007,2006,2005,2004,2003,2002,2001,2000,1999,1998,1997,1996,1995,1994,1993,1992,1991,1990,1989,1988,1987,1986,1985,1984,1983,1982,1981,1980,1979,1978,1977,1976,1975,1974,1973,1972,1971
This statistics in other country:
AfghanistanAlbaniaAlgeriaAmerican SamoaAndorraAngolaAntigua and BarbudaArab WorldArgentinaArmeniaArubaAustraliaAustriaAzerbaijanBahamas, TheBahrainBangladeshBarbadosBelarusBelgiumBelizeBeninBermudaBhutanBoliviaBosnia and HerzegovinaBotswanaBrazilBritish Virgin IslandsBrunei DarussalamBulgariaBurkina FasoBurundiCabo VerdeCambodiaCameroonCanadaCaribbean small statesCayman IslandsCentral African RepublicCentral Europe and the BalticsChadChileChinaColombiaComorosCongo, Dem. Rep.Congo, Rep.Costa RicaCote d'IvoireCroatiaCubaCyprusCzech RepublicDenmarkDjiboutiDominicaDominican RepublicEarly-demographic dividendEast Asia & PacificEast Asia & Pacific (excluding high income)East Asia & Pacific (IDA & IBRD countries)EcuadorEgypt, Arab Rep.El SalvadorEquatorial GuineaEritreaEstoniaEthiopiaEuro areaEurope & Central AsiaEurope & Central Asia (excluding high income)Europe & Central Asia (IDA & IBRD countries)European UnionFaroe IslandsFijiFinlandFragile and conflict affected situationsFranceFrench PolynesiaGabonGambia, TheGeorgiaGermanyGhanaGibraltarGreeceGreenlandGrenadaGuamGuatemalaGuineaGuinea-BissauGuyanaHaitiHeavily indebted poor countries (HIPC)High incomeHondurasHong Kong SAR, ChinaHungaryIBRD onlyIcelandIDA & IBRD totalIDA blendIDA onlyIDA totalIndiaIndonesiaIran, Islamic Rep.IraqIrelandIsraelItalyJamaicaJapanJordanKazakhstanKenyaKiribatiKorea, Dem. People’s Rep.Korea, Rep.KosovoKuwaitKyrgyz RepublicLao PDRLate-demographic dividendLatin America & Caribbean Latin America & Caribbean (excluding high income)Latin America & the Caribbean (IDA & IBRD countries)LatviaLeast developed countries: UN classificationLebanonLesothoLiberiaLibyaLithuaniaLow & middle incomeLow incomeLower middle incomeLuxembourgMacao SAR, ChinaMacedonia, FYRMadagascarMalawiMalaysiaMaldivesMaliMaltaMarshall IslandsMauritaniaMauritiusMexicoMicronesia, Fed. Sts.Middle East & North AfricaMiddle East & North Africa (excluding high income)Middle East & North Africa (IDA & IBRD countries)Middle incomeMoldovaMongoliaMontenegroMoroccoMozambiqueMyanmarNamibiaNauruNepalNetherlandsNew CaledoniaNew ZealandNicaraguaNigerNigeriaNorth AmericaNorthern Mariana IslandsNorwayOECD membersOmanOther small statesPacific island small statesPakistanPalauPanamaPapua New GuineaParaguayPeruPhilippinesPolandPortugalPost-demographic dividendPre-demographic dividendPuerto RicoQatarRomaniaRussian FederationRwandaSamoaSao Tome and PrincipeSaudi ArabiaSenegalSerbiaSeychellesSierra LeoneSingaporeSlovak RepublicSloveniaSmall statesSolomon IslandsSomaliaSouth AfricaSouth AsiaSouth Asia (IDA & IBRD)SpainSri LankaSt. Kitts and NevisSt. LuciaSt. Vincent and the GrenadinesSub-Saharan Africa Sub-Saharan Africa (excluding high income)Sub-Saharan Africa (IDA & IBRD countries)SudanSurinameSwazilandSwedenSwitzerlandSyrian Arab RepublicTajikistanTanzaniaThailandTimor-LesteTogoTongaTrinidad and TobagoTunisiaTurkeyTurkmenistanTurks and Caicos IslandsTuvaluUgandaUkraineUnited Arab EmiratesUnited KingdomUnited StatesUpper middle incomeUruguayUzbekistanVanuatuVenezuela, RBVietnamVirgin Islands (U.S.)WorldYemen, Rep.ZambiaZimbabwe Timeline:
This timeline shows a graph from 1971 to 2013 of Uganda. No data until 1970. Number of actual observations by date: 43.
Source name:
World Development Indicators
Source organization:
European Commission, Joint Research Centre (JRC)/Netherlands Environmental Assessment Agency (PBL). Emission Database for Global Atmospheric Research (EDGAR): http://edgar.jrc.ec.europa.eu/
Categories, topics:
Climate Change, Environment
Last updated:
apr 23, 2017
Indicators value changes by year
Minimum:
5.064K
jan 1, 1975
Maximum:
23.761K
jan 1, 2008
At the date of observation
Value
Absolute change
Change from previous value
jan 1, 1971
5.717K
+5.717K
0.0%
jan 1, 1972
5.622K
-94.271
-1.65%
jan 1, 1973
5.669K
+46.097
0.82%
jan 1, 1974
6.079K
+410.533
7.24%
jan 1, 1975
5.064K
-1.015K
-16.7%
jan 1, 1976
5.514K
+450.12
8.89%
jan 1, 1977
5.758K
+243.722
4.42%
jan 1, 1978
6.433K
+675.118
11.73%
jan 1, 1979
5.896K
-537.261
-8.35%
jan 1, 1980
6.176K
+280.209
4.75%
jan 1, 1981
7.019K
+843.479
13.66%
jan 1, 1982
6.062K
-956.908
-13.63%
jan 1, 1983
6.86K
+797.971
13.16%
jan 1, 1984
6.535K
-325.128
-4.74%
jan 1, 1985
6.529K
-6.603
-0.1%
jan 1, 1986
6.064K
-464.845
-7.12%
jan 1, 1987
6.255K
+191.456
3.16%
jan 1, 1988
5.887K
-368.187
-5.89%
jan 1, 1989
5.772K
-114.886
-1.95%
jan 1, 1990
6.402K
+630.292
10.92%
jan 1, 1991
7.999K
+1.597K
24.94%
jan 1, 1992
6.769K
-1.23K
-15.38%
jan 1, 1993
7.658K
+889.08
13.13%
jan 1, 1994
7.376K
-282.162
-3.68%
jan 1, 1995
7.227K
-149.048
-2.02%
jan 1, 1996
7.92K
+693.47
9.6%
jan 1, 1997
7.756K
-163.99
-2.07%
jan 1, 1998
7.938K
+181.877
2.34%
jan 1, 1999
7.175K
-762.848
-9.61%
jan 1, 2000
7.92K
+744.992
10.38%
jan 1, 2001
7.567K
-353.834
-4.47%
jan 1, 2002
7.473K
-93.155
-1.23%
jan 1, 2003
7.279K
-194.06
-2.6%
jan 1, 2004
8.514K
+1.235K
16.97%
jan 1, 2005
7.519K
-995.348
-11.69%
jan 1, 2006
10.482K
+2.963K
39.4%
jan 1, 2007
9.304K
-1.177K
-11.23%
jan 1, 2008
23.761K
+14.456K
155.37%
jan 1, 2009
15.101K
-8.66K
-36.45%
jan 1, 2010
10.438K
-4.663K
-30.88%
jan 1, 2011
14.639K
+4.201K
40.25%
jan 1, 2012
14.785K
+146.389
1.0%
jan 1, 2013
14.932K
+146.389
0.99%
Ranking of countries by current statistics by years


Comments: