29
/
en
AIzaSyAYiBZKx7MnpbEhh9jyipgxe19OcubqV5w
April 1, 2024
50318
Middle East & North Africa (IDA & IBRD countries)
TMN
false
2
1
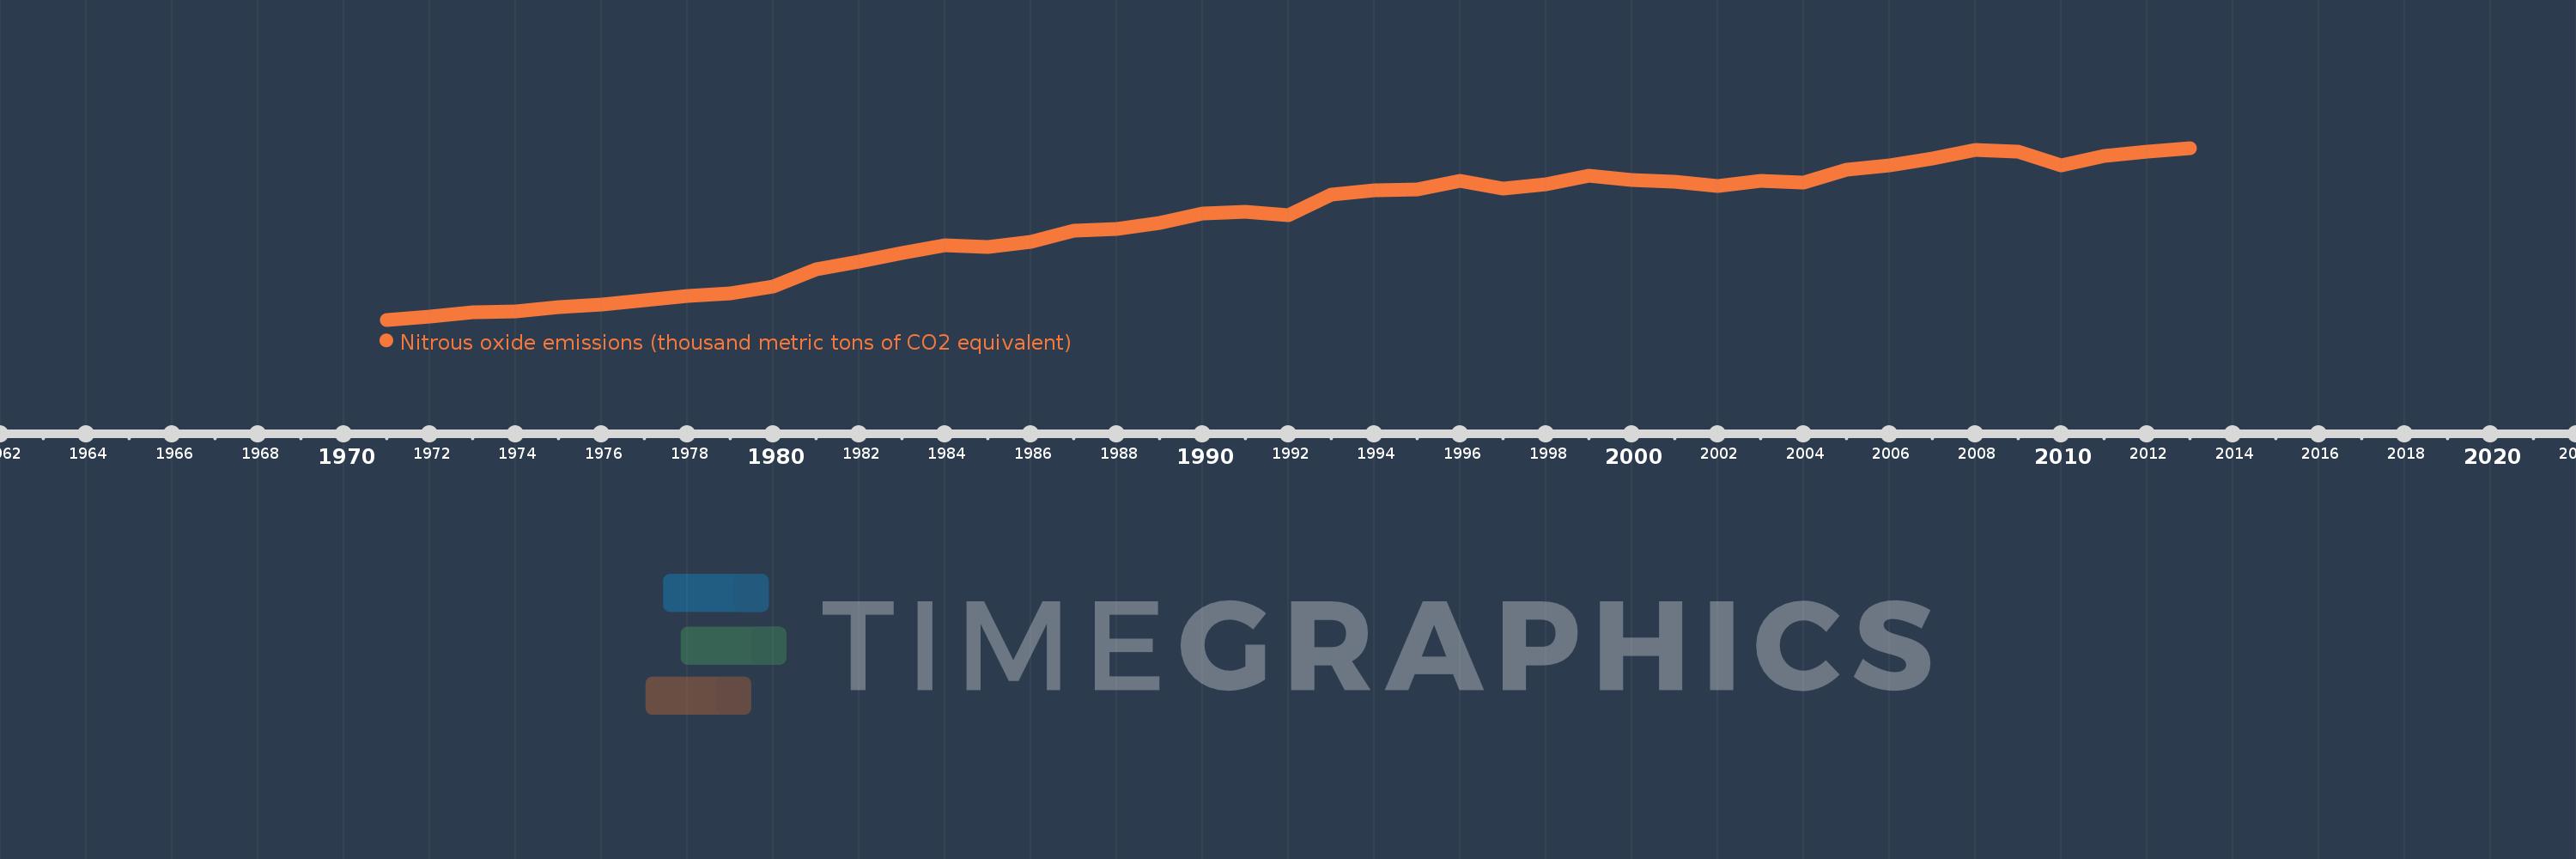
Nitrous oxide emissions (thousand metric tons of CO2 equivalent)
2013,2012,2011,2010,2009,2008,2007,2006,2005,2004,2003,2002,2001,2000,1999,1998,1997,1996,1995,1994,1993,1992,1991,1990,1989,1988,1987,1986,1985,1984,1983,1982,1981,1980,1979,1978,1977,1976,1975,1974,1973,1972,1971
This statistics in other country:
AfghanistanAlbaniaAlgeriaAmerican SamoaAndorraAngolaAntigua and BarbudaArab WorldArgentinaArmeniaArubaAustraliaAustriaAzerbaijanBahamas, TheBahrainBangladeshBarbadosBelarusBelgiumBelizeBeninBermudaBhutanBoliviaBosnia and HerzegovinaBotswanaBrazilBritish Virgin IslandsBrunei DarussalamBulgariaBurkina FasoBurundiCabo VerdeCambodiaCameroonCanadaCaribbean small statesCayman IslandsCentral African RepublicCentral Europe and the BalticsChadChileChinaColombiaComorosCongo, Dem. Rep.Congo, Rep.Costa RicaCote d'IvoireCroatiaCubaCyprusCzech RepublicDenmarkDjiboutiDominicaDominican RepublicEarly-demographic dividendEast Asia & PacificEast Asia & Pacific (excluding high income)East Asia & Pacific (IDA & IBRD countries)EcuadorEgypt, Arab Rep.El SalvadorEquatorial GuineaEritreaEstoniaEthiopiaEuro areaEurope & Central AsiaEurope & Central Asia (excluding high income)Europe & Central Asia (IDA & IBRD countries)European UnionFaroe IslandsFijiFinlandFragile and conflict affected situationsFranceFrench PolynesiaGabonGambia, TheGeorgiaGermanyGhanaGibraltarGreeceGreenlandGrenadaGuamGuatemalaGuineaGuinea-BissauGuyanaHaitiHeavily indebted poor countries (HIPC)High incomeHondurasHong Kong SAR, ChinaHungaryIBRD onlyIcelandIDA & IBRD totalIDA blendIDA onlyIDA totalIndiaIndonesiaIran, Islamic Rep.IraqIrelandIsraelItalyJamaicaJapanJordanKazakhstanKenyaKiribatiKorea, Dem. People’s Rep.Korea, Rep.KosovoKuwaitKyrgyz RepublicLao PDRLate-demographic dividendLatin America & Caribbean Latin America & Caribbean (excluding high income)Latin America & the Caribbean (IDA & IBRD countries)LatviaLeast developed countries: UN classificationLebanonLesothoLiberiaLibyaLithuaniaLow & middle incomeLow incomeLower middle incomeLuxembourgMacao SAR, ChinaMacedonia, FYRMadagascarMalawiMalaysiaMaldivesMaliMaltaMarshall IslandsMauritaniaMauritiusMexicoMicronesia, Fed. Sts.Middle East & North AfricaMiddle East & North Africa (excluding high income)Middle East & North Africa (IDA & IBRD countries)Middle incomeMoldovaMongoliaMontenegroMoroccoMozambiqueMyanmarNamibiaNauruNepalNetherlandsNew CaledoniaNew ZealandNicaraguaNigerNigeriaNorth AmericaNorthern Mariana IslandsNorwayOECD membersOmanOther small statesPacific island small statesPakistanPalauPanamaPapua New GuineaParaguayPeruPhilippinesPolandPortugalPost-demographic dividendPre-demographic dividendPuerto RicoQatarRomaniaRussian FederationRwandaSamoaSao Tome and PrincipeSaudi ArabiaSenegalSerbiaSeychellesSierra LeoneSingaporeSlovak RepublicSloveniaSmall statesSolomon IslandsSomaliaSouth AfricaSouth AsiaSouth Asia (IDA & IBRD)SpainSri LankaSt. Kitts and NevisSt. LuciaSt. Vincent and the GrenadinesSub-Saharan Africa Sub-Saharan Africa (excluding high income)Sub-Saharan Africa (IDA & IBRD countries)SudanSurinameSwazilandSwedenSwitzerlandSyrian Arab RepublicTajikistanTanzaniaThailandTimor-LesteTogoTongaTrinidad and TobagoTunisiaTurkeyTurkmenistanTurks and Caicos IslandsTuvaluUgandaUkraineUnited Arab EmiratesUnited KingdomUnited StatesUpper middle incomeUruguayUzbekistanVanuatuVenezuela, RBVietnamVirgin Islands (U.S.)WorldYemen, Rep.ZambiaZimbabwe Timeline:
This timeline shows a graph from 1971 to 2013 of Middle East & North Africa (IDA & IBRD countries). No data until 1970. Number of actual observations by date: 43.
Source name:
World Development Indicators
Source organization:
European Commission, Joint Research Centre (JRC)/Netherlands Environmental Assessment Agency (PBL). Emission Database for Global Atmospheric Research (EDGAR): http://edgar.jrc.ec.europa.eu/
Categories, topics:
Climate Change, Environment
Last updated:
apr 23, 2017
Indicators value changes by year
Minimum:
32.083K
jan 1, 1971
Maximum:
83.123K
jan 1, 2013
At the date of observation
Value
Absolute change
Change from previous value
jan 1, 1971
32.083K
+32.083K
0.0%
jan 1, 1972
33.029K
+945.719
2.95%
jan 1, 1973
34.215K
+1.186K
3.59%
jan 1, 1974
34.562K
+347.114
1.01%
jan 1, 1975
35.748K
+1.186K
3.43%
jan 1, 1976
36.606K
+857.825
2.4%
jan 1, 1977
37.947K
+1.341K
3.66%
jan 1, 1978
39.269K
+1.323K
3.49%
jan 1, 1979
39.847K
+577.922
1.47%
jan 1, 1980
41.847K
+2.0K
5.02%
jan 1, 1981
46.962K
+5.115K
12.22%
jan 1, 1982
49.31K
+2.348K
5.0%
jan 1, 1983
51.94K
+2.631K
5.34%
jan 1, 1984
54.12K
+2.179K
4.2%
jan 1, 1985
53.591K
-528.72
-0.98%
jan 1, 1986
55.105K
+1.514K
2.83%
jan 1, 1987
58.463K
+3.358K
6.09%
jan 1, 1988
59.048K
+585.018
1.0%
jan 1, 1989
60.795K
+1.748K
2.96%
jan 1, 1990
63.675K
+2.879K
4.74%
jan 1, 1991
64.233K
+557.906
0.88%
jan 1, 1992
63.257K
-976.011
-1.52%
jan 1, 1993
69.365K
+6.109K
9.66%
jan 1, 1994
70.48K
+1.115K
1.61%
jan 1, 1995
70.847K
+366.6
0.52%
jan 1, 1996
73.444K
+2.597K
3.67%
jan 1, 1997
71.103K
-2.341K
-3.19%
jan 1, 1998
72.232K
+1.129K
1.59%
jan 1, 1999
74.918K
+2.687K
3.72%
jan 1, 2000
73.699K
-1.219K
-1.63%
jan 1, 2001
73.204K
-495.01
-0.67%
jan 1, 2002
71.736K
-1.469K
-2.01%
jan 1, 2003
73.459K
+1.723K
2.4%
jan 1, 2004
72.782K
-676.729
-0.92%
jan 1, 2005
76.668K
+3.886K
5.34%
jan 1, 2006
77.961K
+1.293K
1.69%
jan 1, 2007
80.079K
+2.118K
2.72%
jan 1, 2008
82.505K
+2.426K
3.03%
jan 1, 2009
81.936K
-569.628
-0.69%
jan 1, 2010
78.062K
-3.874K
-4.73%
jan 1, 2011
80.742K
+2.68K
3.43%
jan 1, 2012
81.932K
+1.191K
1.47%
jan 1, 2013
83.123K
+1.191K
1.45%
Ranking of countries by current statistics by years


Comments: