29
/
en
AIzaSyAYiBZKx7MnpbEhh9jyipgxe19OcubqV5w
April 1, 2024
196884
Micronesia, Fed. Sts.
FSM
true
2
1
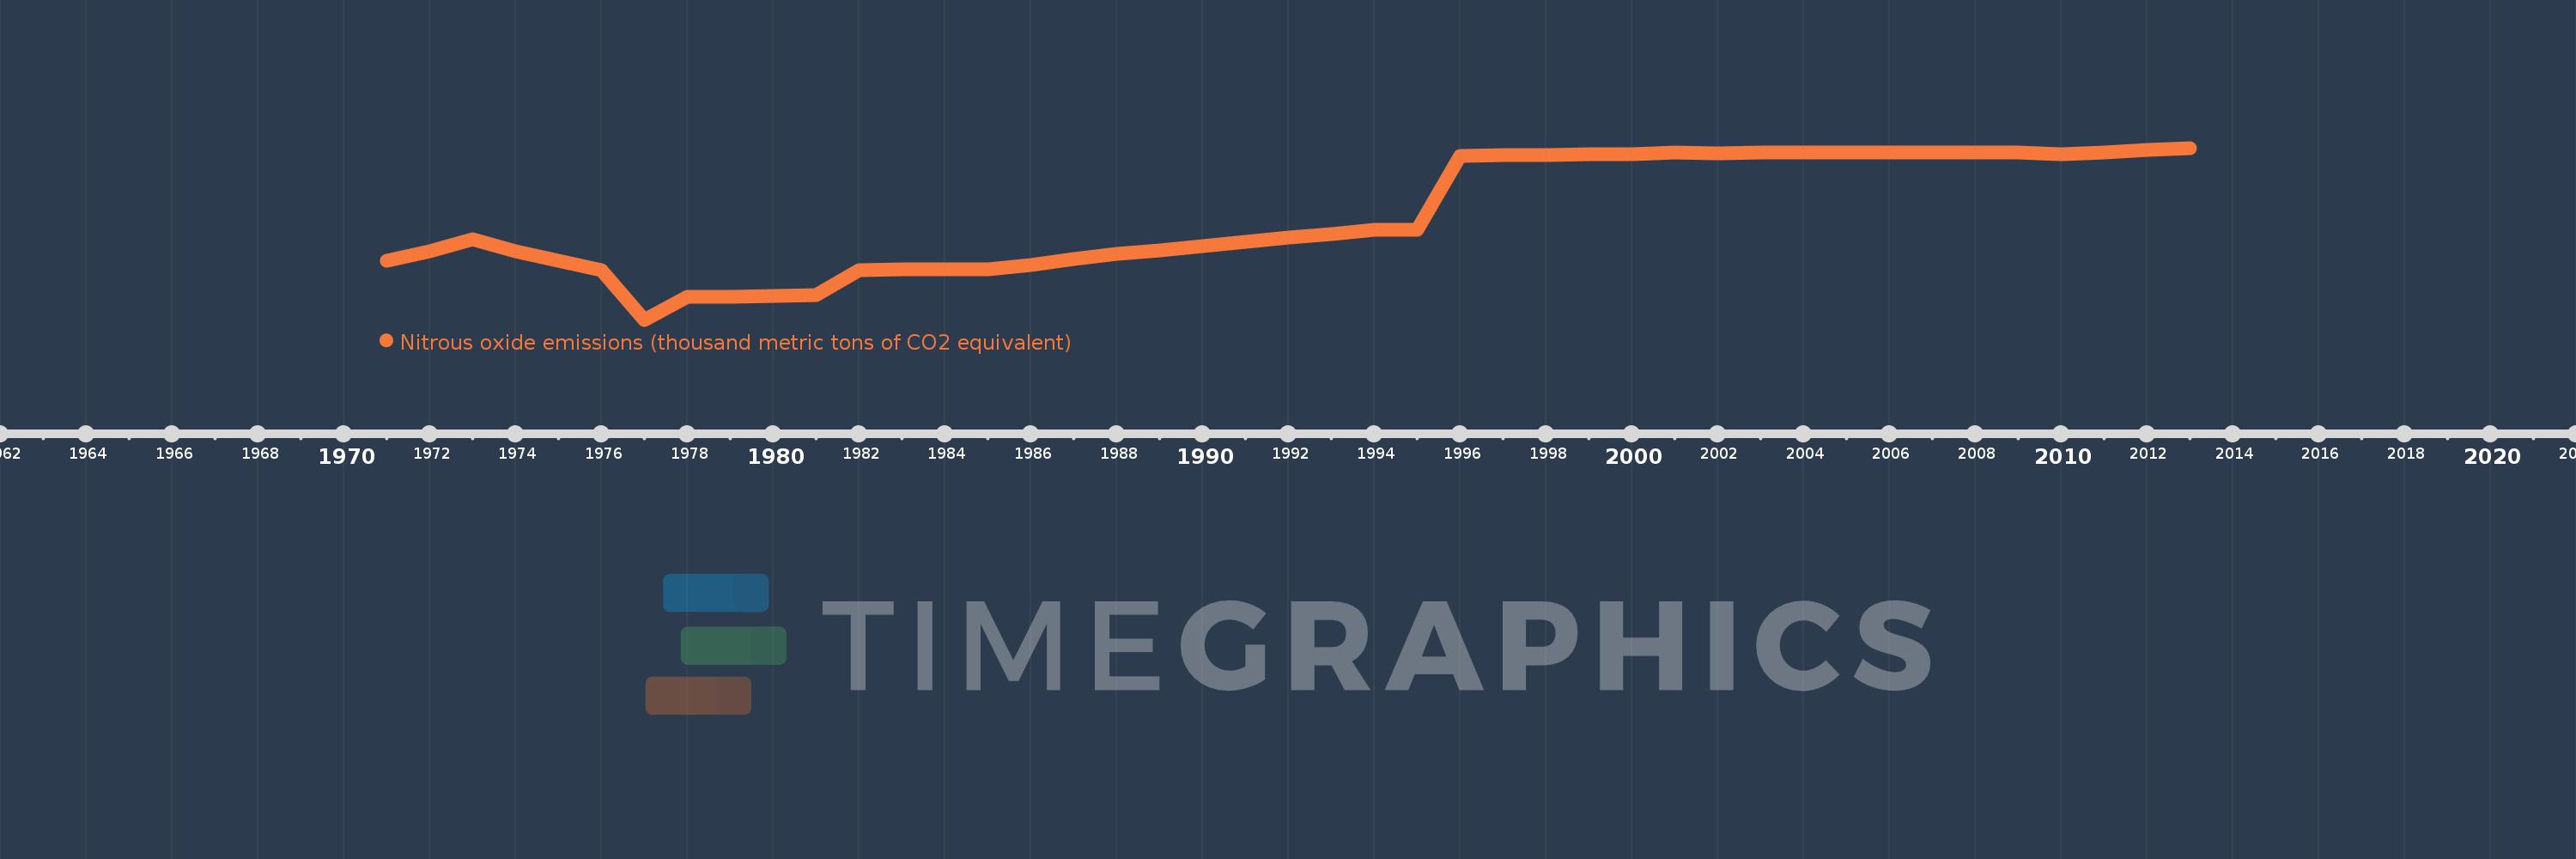
Nitrous oxide emissions (thousand metric tons of CO2 equivalent)
2013,2012,2011,2010,2009,2008,2007,2006,2005,2004,2003,2002,2001,2000,1999,1998,1997,1996,1995,1994,1993,1992,1991,1990,1989,1988,1987,1986,1985,1984,1983,1982,1981,1980,1979,1978,1977,1976,1975,1974,1973,1972,1971
This statistics in other country:
AfghanistanAlbaniaAlgeriaAmerican SamoaAndorraAngolaAntigua and BarbudaArab WorldArgentinaArmeniaArubaAustraliaAustriaAzerbaijanBahamas, TheBahrainBangladeshBarbadosBelarusBelgiumBelizeBeninBermudaBhutanBoliviaBosnia and HerzegovinaBotswanaBrazilBritish Virgin IslandsBrunei DarussalamBulgariaBurkina FasoBurundiCabo VerdeCambodiaCameroonCanadaCaribbean small statesCayman IslandsCentral African RepublicCentral Europe and the BalticsChadChileChinaColombiaComorosCongo, Dem. Rep.Congo, Rep.Costa RicaCote d'IvoireCroatiaCubaCyprusCzech RepublicDenmarkDjiboutiDominicaDominican RepublicEarly-demographic dividendEast Asia & PacificEast Asia & Pacific (excluding high income)East Asia & Pacific (IDA & IBRD countries)EcuadorEgypt, Arab Rep.El SalvadorEquatorial GuineaEritreaEstoniaEthiopiaEuro areaEurope & Central AsiaEurope & Central Asia (excluding high income)Europe & Central Asia (IDA & IBRD countries)European UnionFaroe IslandsFijiFinlandFragile and conflict affected situationsFranceFrench PolynesiaGabonGambia, TheGeorgiaGermanyGhanaGibraltarGreeceGreenlandGrenadaGuamGuatemalaGuineaGuinea-BissauGuyanaHaitiHeavily indebted poor countries (HIPC)High incomeHondurasHong Kong SAR, ChinaHungaryIBRD onlyIcelandIDA & IBRD totalIDA blendIDA onlyIDA totalIndiaIndonesiaIran, Islamic Rep.IraqIrelandIsraelItalyJamaicaJapanJordanKazakhstanKenyaKiribatiKorea, Dem. People’s Rep.Korea, Rep.KosovoKuwaitKyrgyz RepublicLao PDRLate-demographic dividendLatin America & Caribbean Latin America & Caribbean (excluding high income)Latin America & the Caribbean (IDA & IBRD countries)LatviaLeast developed countries: UN classificationLebanonLesothoLiberiaLibyaLithuaniaLow & middle incomeLow incomeLower middle incomeLuxembourgMacao SAR, ChinaMacedonia, FYRMadagascarMalawiMalaysiaMaldivesMaliMaltaMarshall IslandsMauritaniaMauritiusMexicoMicronesia, Fed. Sts.Middle East & North AfricaMiddle East & North Africa (excluding high income)Middle East & North Africa (IDA & IBRD countries)Middle incomeMoldovaMongoliaMontenegroMoroccoMozambiqueMyanmarNamibiaNauruNepalNetherlandsNew CaledoniaNew ZealandNicaraguaNigerNigeriaNorth AmericaNorthern Mariana IslandsNorwayOECD membersOmanOther small statesPacific island small statesPakistanPalauPanamaPapua New GuineaParaguayPeruPhilippinesPolandPortugalPost-demographic dividendPre-demographic dividendPuerto RicoQatarRomaniaRussian FederationRwandaSamoaSao Tome and PrincipeSaudi ArabiaSenegalSerbiaSeychellesSierra LeoneSingaporeSlovak RepublicSloveniaSmall statesSolomon IslandsSomaliaSouth AfricaSouth AsiaSouth Asia (IDA & IBRD)SpainSri LankaSt. Kitts and NevisSt. LuciaSt. Vincent and the GrenadinesSub-Saharan Africa Sub-Saharan Africa (excluding high income)Sub-Saharan Africa (IDA & IBRD countries)SudanSurinameSwazilandSwedenSwitzerlandSyrian Arab RepublicTajikistanTanzaniaThailandTimor-LesteTogoTongaTrinidad and TobagoTunisiaTurkeyTurkmenistanTurks and Caicos IslandsTuvaluUgandaUkraineUnited Arab EmiratesUnited KingdomUnited StatesUpper middle incomeUruguayUzbekistanVanuatuVenezuela, RBVietnamVirgin Islands (U.S.)WorldYemen, Rep.ZambiaZimbabwe Timeline:
This timeline shows a graph from 1971 to 2013 of Micronesia, Fed. Sts.. No data until 1970. Number of actual observations by date: 43.
Source name:
World Development Indicators
Source organization:
European Commission, Joint Research Centre (JRC)/Netherlands Environmental Assessment Agency (PBL). Emission Database for Global Atmospheric Research (EDGAR): http://edgar.jrc.ec.europa.eu/
Categories, topics:
Climate Change, Environment
Last updated:
apr 23, 2017
Indicators value changes by year
Maximum:
11.068
jan 1, 2013
At the date of observation
Value
Absolute change
Change from previous value
jan 1, 1971
5.51
+5.51
0.0%
jan 1, 1972
5.998
+0.488
8.85%
jan 1, 1973
6.576
+0.578
9.64%
jan 1, 1974
6.003
-0.573
-8.71%
jan 1, 1975
5.521
-0.482
-8.03%
jan 1, 1976
5.04
-0.481
-8.72%
jan 1, 1977
2.619
-2.421
-48.04%
jan 1, 1978
3.751
+1.132
43.23%
jan 1, 1979
3.744
-0.007
-0.18%
jan 1, 1980
3.798
+0.054
1.44%
jan 1, 1981
3.852
+0.054
1.43%
jan 1, 1982
5.074
+1.222
31.72%
jan 1, 1983
5.08
+0.006
0.11%
jan 1, 1984
5.086
+0.006
0.13%
jan 1, 1985
5.093
+0.007
0.14%
jan 1, 1986
5.294
+0.201
3.94%
jan 1, 1987
5.593
+0.299
5.65%
jan 1, 1988
5.843
+0.25
4.46%
jan 1, 1989
6.044
+0.201
3.44%
jan 1, 1990
6.245
+0.201
3.33%
jan 1, 1991
6.447
+0.202
3.23%
jan 1, 1992
6.648
+0.201
3.12%
jan 1, 1993
6.85
+0.202
3.04%
jan 1, 1994
7.053
+0.202
2.95%
jan 1, 1995
7.058
+0.005
0.07%
jan 1, 1996
10.673
+3.615
51.22%
jan 1, 1997
10.704
+0.031
0.29%
jan 1, 1998
10.718
+0.014
0.13%
jan 1, 1999
10.739
+0.021
0.2%
jan 1, 2000
10.758
+0.019
0.18%
jan 1, 2001
10.832
+0.074
0.68%
jan 1, 2002
10.803
-0.029
-0.27%
jan 1, 2003
10.85
+0.047
0.44%
jan 1, 2004
10.863
+0.014
0.12%
jan 1, 2005
10.847
-0.017
-0.15%
jan 1, 2006
10.843
-0.004
-0.03%
jan 1, 2007
10.842
-0.001
-0.01%
jan 1, 2008
10.86
+0.018
0.16%
jan 1, 2009
10.86
0.0
0.0%
jan 1, 2010
10.768
-0.092
-0.85%
jan 1, 2011
10.851
+0.083
0.77%
jan 1, 2012
10.959
+0.109
1.0%
jan 1, 2013
11.068
+0.109
0.99%
Ranking of countries by current statistics by years


Comments: