29
/
en
AIzaSyAYiBZKx7MnpbEhh9jyipgxe19OcubqV5w
April 1, 2024
76502
Bahamas, The
BHS
true
2
1
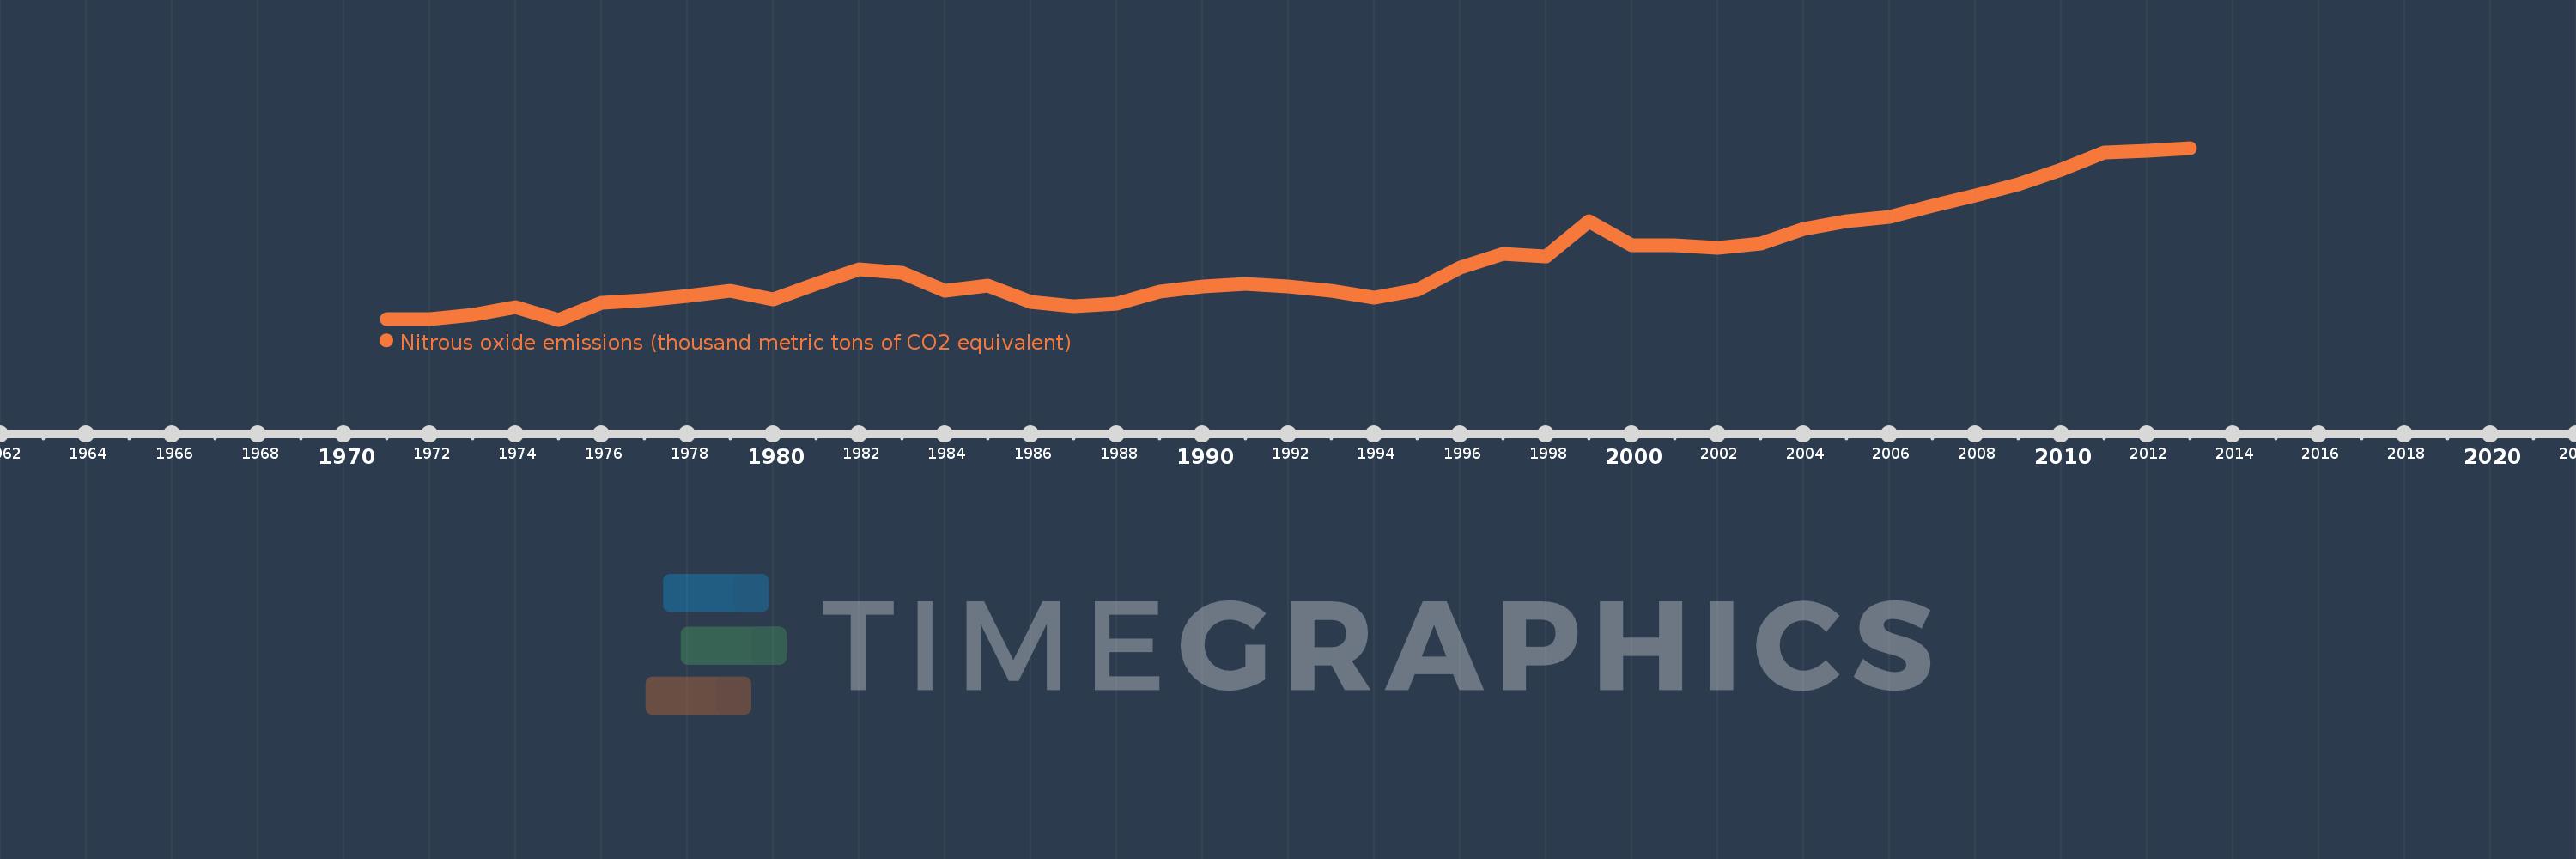
Nitrous oxide emissions (thousand metric tons of CO2 equivalent)
2013,2012,2011,2010,2009,2008,2007,2006,2005,2004,2003,2002,2001,2000,1999,1998,1997,1996,1995,1994,1993,1992,1991,1990,1989,1988,1987,1986,1985,1984,1983,1982,1981,1980,1979,1978,1977,1976,1975,1974,1973,1972,1971
This statistics in other country:
AfghanistanAlbaniaAlgeriaAmerican SamoaAndorraAngolaAntigua and BarbudaArab WorldArgentinaArmeniaArubaAustraliaAustriaAzerbaijanBahamas, TheBahrainBangladeshBarbadosBelarusBelgiumBelizeBeninBermudaBhutanBoliviaBosnia and HerzegovinaBotswanaBrazilBritish Virgin IslandsBrunei DarussalamBulgariaBurkina FasoBurundiCabo VerdeCambodiaCameroonCanadaCaribbean small statesCayman IslandsCentral African RepublicCentral Europe and the BalticsChadChileChinaColombiaComorosCongo, Dem. Rep.Congo, Rep.Costa RicaCote d'IvoireCroatiaCubaCyprusCzech RepublicDenmarkDjiboutiDominicaDominican RepublicEarly-demographic dividendEast Asia & PacificEast Asia & Pacific (excluding high income)East Asia & Pacific (IDA & IBRD countries)EcuadorEgypt, Arab Rep.El SalvadorEquatorial GuineaEritreaEstoniaEthiopiaEuro areaEurope & Central AsiaEurope & Central Asia (excluding high income)Europe & Central Asia (IDA & IBRD countries)European UnionFaroe IslandsFijiFinlandFragile and conflict affected situationsFranceFrench PolynesiaGabonGambia, TheGeorgiaGermanyGhanaGibraltarGreeceGreenlandGrenadaGuamGuatemalaGuineaGuinea-BissauGuyanaHaitiHeavily indebted poor countries (HIPC)High incomeHondurasHong Kong SAR, ChinaHungaryIBRD onlyIcelandIDA & IBRD totalIDA blendIDA onlyIDA totalIndiaIndonesiaIran, Islamic Rep.IraqIrelandIsraelItalyJamaicaJapanJordanKazakhstanKenyaKiribatiKorea, Dem. People’s Rep.Korea, Rep.KosovoKuwaitKyrgyz RepublicLao PDRLate-demographic dividendLatin America & Caribbean Latin America & Caribbean (excluding high income)Latin America & the Caribbean (IDA & IBRD countries)LatviaLeast developed countries: UN classificationLebanonLesothoLiberiaLibyaLithuaniaLow & middle incomeLow incomeLower middle incomeLuxembourgMacao SAR, ChinaMacedonia, FYRMadagascarMalawiMalaysiaMaldivesMaliMaltaMarshall IslandsMauritaniaMauritiusMexicoMicronesia, Fed. Sts.Middle East & North AfricaMiddle East & North Africa (excluding high income)Middle East & North Africa (IDA & IBRD countries)Middle incomeMoldovaMongoliaMontenegroMoroccoMozambiqueMyanmarNamibiaNauruNepalNetherlandsNew CaledoniaNew ZealandNicaraguaNigerNigeriaNorth AmericaNorthern Mariana IslandsNorwayOECD membersOmanOther small statesPacific island small statesPakistanPalauPanamaPapua New GuineaParaguayPeruPhilippinesPolandPortugalPost-demographic dividendPre-demographic dividendPuerto RicoQatarRomaniaRussian FederationRwandaSamoaSao Tome and PrincipeSaudi ArabiaSenegalSerbiaSeychellesSierra LeoneSingaporeSlovak RepublicSloveniaSmall statesSolomon IslandsSomaliaSouth AfricaSouth AsiaSouth Asia (IDA & IBRD)SpainSri LankaSt. Kitts and NevisSt. LuciaSt. Vincent and the GrenadinesSub-Saharan Africa Sub-Saharan Africa (excluding high income)Sub-Saharan Africa (IDA & IBRD countries)SudanSurinameSwazilandSwedenSwitzerlandSyrian Arab RepublicTajikistanTanzaniaThailandTimor-LesteTogoTongaTrinidad and TobagoTunisiaTurkeyTurkmenistanTurks and Caicos IslandsTuvaluUgandaUkraineUnited Arab EmiratesUnited KingdomUnited StatesUpper middle incomeUruguayUzbekistanVanuatuVenezuela, RBVietnamVirgin Islands (U.S.)WorldYemen, Rep.ZambiaZimbabwe Timeline:
This timeline shows a graph from 1971 to 2013 of Bahamas, The. No data until 1970. Number of actual observations by date: 43.
Source name:
World Development Indicators
Source organization:
European Commission, Joint Research Centre (JRC)/Netherlands Environmental Assessment Agency (PBL). Emission Database for Global Atmospheric Research (EDGAR): http://edgar.jrc.ec.europa.eu/
Categories, topics:
Climate Change, Environment
Last updated:
apr 23, 2017
Indicators value changes by year
Minimum:
40.903
jan 1, 1975
Maximum:
130.927
jan 1, 2013
At the date of observation
Value
Absolute change
Change from previous value
jan 1, 1971
41.18
+41.18
0.0%
jan 1, 1972
41.26
+0.079
0.19%
jan 1, 1973
43.387
+2.127
5.16%
jan 1, 1974
47.563
+4.176
9.63%
jan 1, 1975
40.903
-6.66
-14.0%
jan 1, 1976
49.752
+8.849
21.63%
jan 1, 1977
51.124
+1.372
2.76%
jan 1, 1978
53.323
+2.2
4.3%
jan 1, 1979
56.183
+2.86
5.36%
jan 1, 1980
51.562
-4.622
-8.23%
jan 1, 1981
59.456
+7.894
15.31%
jan 1, 1982
67.172
+7.717
12.98%
jan 1, 1983
65.739
-1.433
-2.13%
jan 1, 1984
56.019
-9.72
-14.79%
jan 1, 1985
58.665
+2.646
4.72%
jan 1, 1986
50.375
-8.29
-14.13%
jan 1, 1987
47.787
-2.588
-5.14%
jan 1, 1988
49.104
+1.317
2.76%
jan 1, 1989
55.542
+6.437
13.11%
jan 1, 1990
58.377
+2.835
5.1%
jan 1, 1991
59.665
+1.288
2.21%
jan 1, 1992
58.152
-1.513
-2.54%
jan 1, 1993
56.198
-1.954
-3.36%
jan 1, 1994
52.418
-3.78
-6.73%
jan 1, 1995
56.404
+3.986
7.6%
jan 1, 1996
68.186
+11.782
20.89%
jan 1, 1997
75.608
+7.422
10.89%
jan 1, 1998
73.952
-1.656
-2.19%
jan 1, 1999
92.488
+18.536
25.06%
jan 1, 2000
79.98
-12.508
-13.52%
jan 1, 2001
80.036
+0.056
0.07%
jan 1, 2002
78.692
-1.344
-1.68%
jan 1, 2003
80.709
+2.017
2.56%
jan 1, 2004
88.4
+7.691
9.53%
jan 1, 2005
92.533
+4.134
4.68%
jan 1, 2006
94.858
+2.324
2.51%
jan 1, 2007
100.707
+5.849
6.17%
jan 1, 2008
106.166
+5.458
5.42%
jan 1, 2009
111.981
+5.815
5.48%
jan 1, 2010
119.509
+7.528
6.72%
jan 1, 2011
128.36
+8.851
7.41%
jan 1, 2012
129.644
+1.284
1.0%
jan 1, 2013
130.927
+1.284
0.99%
Ranking of countries by current statistics by years


Comments: