29
/
en
AIzaSyAYiBZKx7MnpbEhh9jyipgxe19OcubqV5w
April 1, 2024
44528
Least developed countries: UN classification
LDC
false
2
1
Nitrous oxide emissions (thousand metric tons of CO2 equivalent)
2013,2012,2011,2010,2009,2008,2007,2006,2005,2004,2003,2002,2001,2000,1999,1998,1997,1996,1995,1994,1993,1992,1991,1990,1989,1988,1987,1986,1985,1984,1983,1982,1981,1980,1979,1978,1977,1976,1975,1974,1973,1972,1971
This statistics in other country:
AfghanistanAlbaniaAlgeriaAmerican SamoaAndorraAngolaAntigua and BarbudaArab WorldArgentinaArmeniaArubaAustraliaAustriaAzerbaijanBahamas, TheBahrainBangladeshBarbadosBelarusBelgiumBelizeBeninBermudaBhutanBoliviaBosnia and HerzegovinaBotswanaBrazilBritish Virgin IslandsBrunei DarussalamBulgariaBurkina FasoBurundiCabo VerdeCambodiaCameroonCanadaCaribbean small statesCayman IslandsCentral African RepublicCentral Europe and the BalticsChadChileChinaColombiaComorosCongo, Dem. Rep.Congo, Rep.Costa RicaCote d'IvoireCroatiaCubaCyprusCzech RepublicDenmarkDjiboutiDominicaDominican RepublicEarly-demographic dividendEast Asia & PacificEast Asia & Pacific (excluding high income)East Asia & Pacific (IDA & IBRD countries)EcuadorEgypt, Arab Rep.El SalvadorEquatorial GuineaEritreaEstoniaEthiopiaEuro areaEurope & Central AsiaEurope & Central Asia (excluding high income)Europe & Central Asia (IDA & IBRD countries)European UnionFaroe IslandsFijiFinlandFragile and conflict affected situationsFranceFrench PolynesiaGabonGambia, TheGeorgiaGermanyGhanaGibraltarGreeceGreenlandGrenadaGuamGuatemalaGuineaGuinea-BissauGuyanaHaitiHeavily indebted poor countries (HIPC)High incomeHondurasHong Kong SAR, ChinaHungaryIBRD onlyIcelandIDA & IBRD totalIDA blendIDA onlyIDA totalIndiaIndonesiaIran, Islamic Rep.IraqIrelandIsraelItalyJamaicaJapanJordanKazakhstanKenyaKiribatiKorea, Dem. People’s Rep.Korea, Rep.KosovoKuwaitKyrgyz RepublicLao PDRLate-demographic dividendLatin America & Caribbean Latin America & Caribbean (excluding high income)Latin America & the Caribbean (IDA & IBRD countries)LatviaLeast developed countries: UN classificationLebanonLesothoLiberiaLibyaLithuaniaLow & middle incomeLow incomeLower middle incomeLuxembourgMacao SAR, ChinaMacedonia, FYRMadagascarMalawiMalaysiaMaldivesMaliMaltaMarshall IslandsMauritaniaMauritiusMexicoMicronesia, Fed. Sts.Middle East & North AfricaMiddle East & North Africa (excluding high income)Middle East & North Africa (IDA & IBRD countries)Middle incomeMoldovaMongoliaMontenegroMoroccoMozambiqueMyanmarNamibiaNauruNepalNetherlandsNew CaledoniaNew ZealandNicaraguaNigerNigeriaNorth AmericaNorthern Mariana IslandsNorwayOECD membersOmanOther small statesPacific island small statesPakistanPalauPanamaPapua New GuineaParaguayPeruPhilippinesPolandPortugalPost-demographic dividendPre-demographic dividendPuerto RicoQatarRomaniaRussian FederationRwandaSamoaSao Tome and PrincipeSaudi ArabiaSenegalSerbiaSeychellesSierra LeoneSingaporeSlovak RepublicSloveniaSmall statesSolomon IslandsSomaliaSouth AfricaSouth AsiaSouth Asia (IDA & IBRD)SpainSri LankaSt. Kitts and NevisSt. LuciaSt. Vincent and the GrenadinesSub-Saharan Africa Sub-Saharan Africa (excluding high income)Sub-Saharan Africa (IDA & IBRD countries)SudanSurinameSwazilandSwedenSwitzerlandSyrian Arab RepublicTajikistanTanzaniaThailandTimor-LesteTogoTongaTrinidad and TobagoTunisiaTurkeyTurkmenistanTurks and Caicos IslandsTuvaluUgandaUkraineUnited Arab EmiratesUnited KingdomUnited StatesUpper middle incomeUruguayUzbekistanVanuatuVenezuela, RBVietnamVirgin Islands (U.S.)WorldYemen, Rep.ZambiaZimbabwe Timeline:
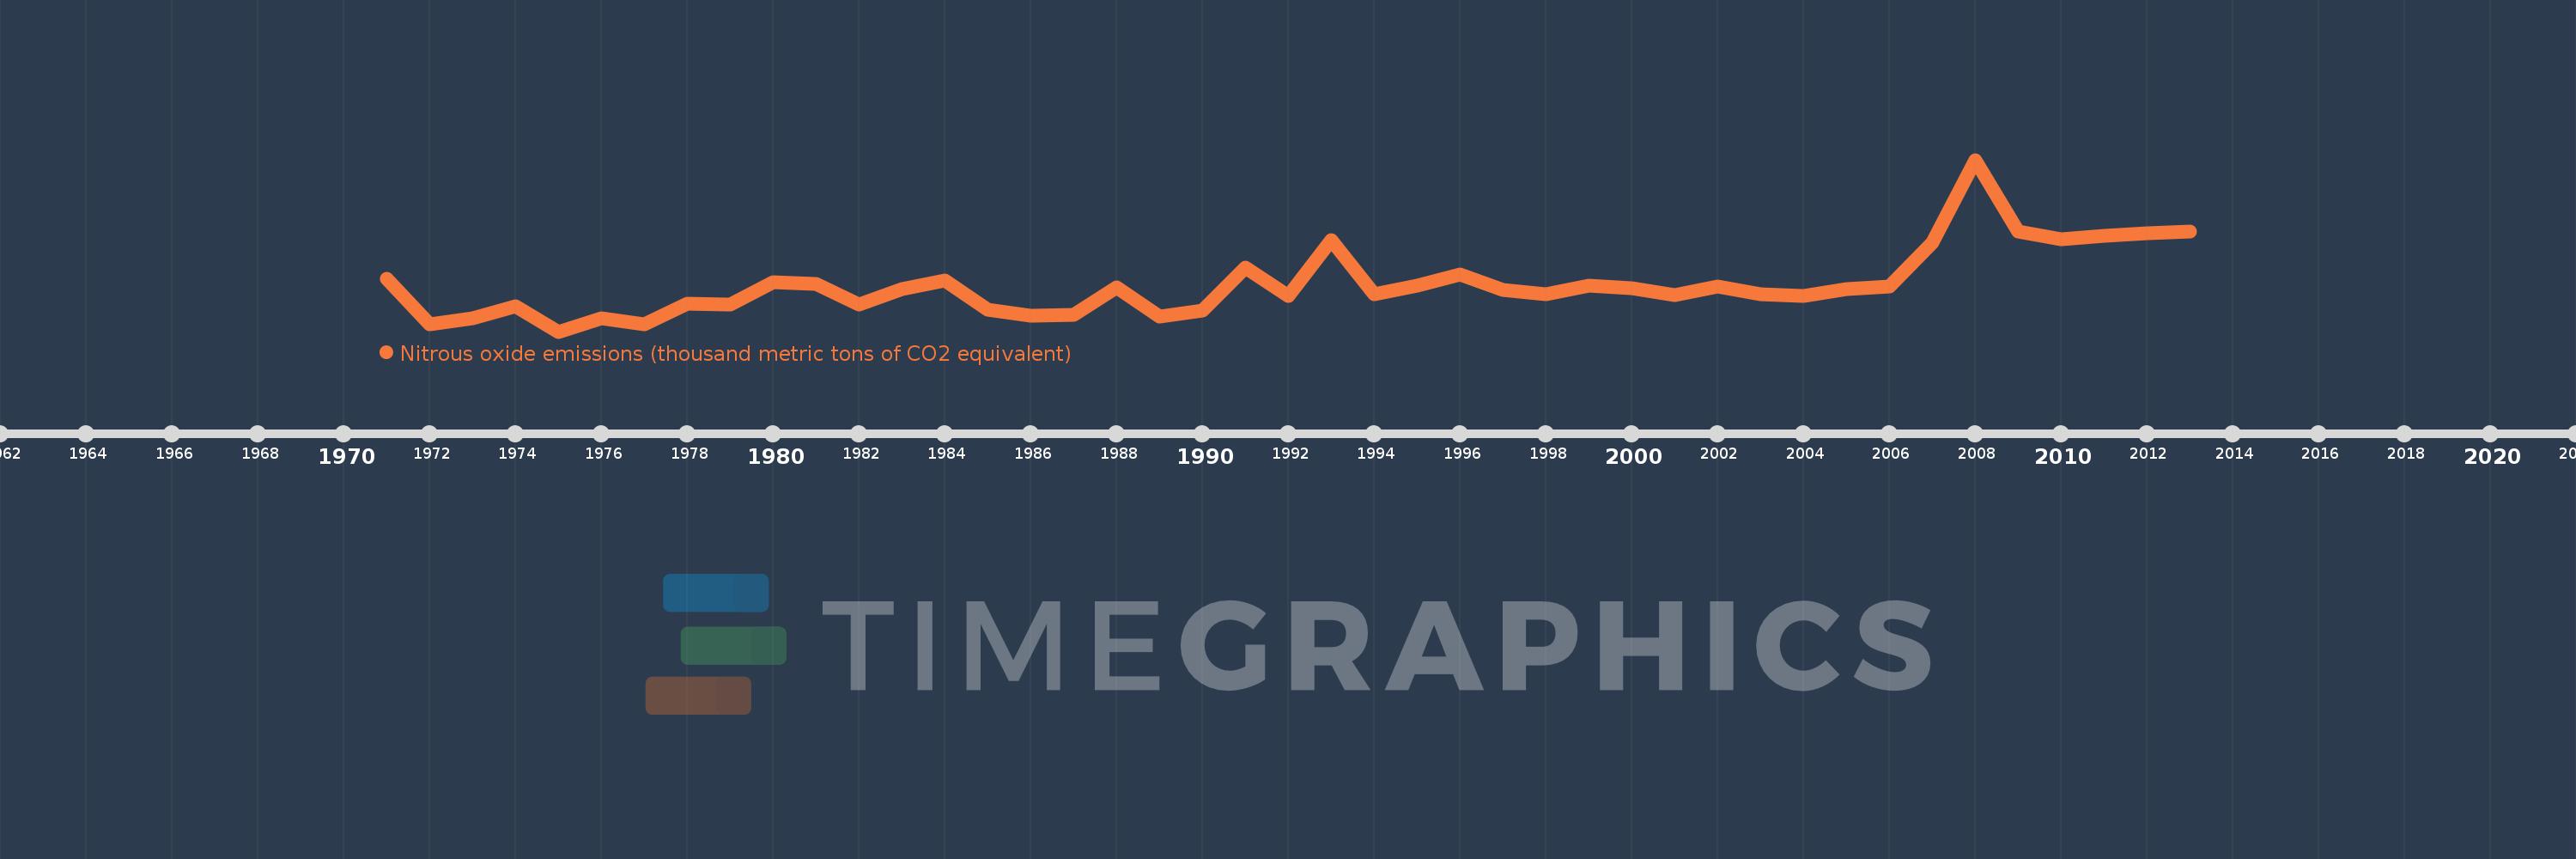
This timeline shows a graph from 1971 to 2013 of Least developed countries: UN classification. No data until 1970. Number of actual observations by date: 43.
Source name:
World Development Indicators
Source organization:
European Commission, Joint Research Centre (JRC)/Netherlands Environmental Assessment Agency (PBL). Emission Database for Global Atmospheric Research (EDGAR): http://edgar.jrc.ec.europa.eu/
Categories, topics:
Climate Change, Environment
Last updated:
apr 23, 2017
Indicators value changes by year
Minimum:
257.452K
jan 1, 1975
Maximum:
724.47K
jan 1, 2008
At the date of observation
Value
Absolute change
Change from previous value
jan 1, 1971
401.556K
+401.556K
0.0%
jan 1, 1972
278.45K
-123.106K
-30.66%
jan 1, 1973
293.667K
+15.217K
5.46%
jan 1, 1974
326.536K
+32.869K
11.19%
jan 1, 1975
257.452K
-69.084K
-21.16%
jan 1, 1976
292.67K
+35.218K
13.68%
jan 1, 1977
277.872K
-14.798K
-5.06%
jan 1, 1978
332.379K
+54.507K
19.62%
jan 1, 1979
331.472K
-906.259
-0.27%
jan 1, 1980
390.594K
+59.122K
17.84%
jan 1, 1981
386.402K
-4.192K
-1.07%
jan 1, 1982
330.782K
-55.62K
-14.39%
jan 1, 1983
372.636K
+41.854K
12.65%
jan 1, 1984
396.043K
+23.407K
6.28%
jan 1, 1985
316.625K
-79.418K
-20.05%
jan 1, 1986
300.34K
-16.285K
-5.14%
jan 1, 1987
302.773K
+2.433K
0.81%
jan 1, 1988
376.862K
+74.089K
24.47%
jan 1, 1989
299.298K
-77.563K
-20.58%
jan 1, 1990
315.653K
+16.355K
5.46%
jan 1, 1991
431.528K
+115.875K
36.71%
jan 1, 1992
355.295K
-76.234K
-17.67%
jan 1, 1993
505.635K
+150.341K
42.31%
jan 1, 1994
358.42K
-147.215K
-29.11%
jan 1, 1995
381.624K
+23.203K
6.47%
jan 1, 1996
411.975K
+30.352K
7.95%
jan 1, 1997
370.887K
-41.088K
-9.97%
jan 1, 1998
359.479K
-11.408K
-3.08%
jan 1, 1999
381.402K
+21.923K
6.1%
jan 1, 2000
374.245K
-7.157K
-1.88%
jan 1, 2001
355.964K
-18.281K
-4.88%
jan 1, 2002
380.677K
+24.714K
6.94%
jan 1, 2003
360.018K
-20.659K
-5.43%
jan 1, 2004
353.914K
-6.105K
-1.7%
jan 1, 2005
373.381K
+19.467K
5.5%
jan 1, 2006
379.232K
+5.851K
1.57%
jan 1, 2007
499.166K
+119.934K
31.63%
jan 1, 2008
724.47K
+225.304K
45.14%
jan 1, 2009
529.002K
-195.468K
-26.98%
jan 1, 2010
509.374K
-19.628K
-3.71%
jan 1, 2011
518.981K
+9.607K
1.89%
jan 1, 2012
524.171K
+5.19K
1.0%
jan 1, 2013
529.36K
+5.19K
0.99%
Ranking of countries by current statistics by years


Comments: