29
/
en
AIzaSyAYiBZKx7MnpbEhh9jyipgxe19OcubqV5w
April 1, 2024
151888
Hong Kong SAR, China
HKG
true
2
1
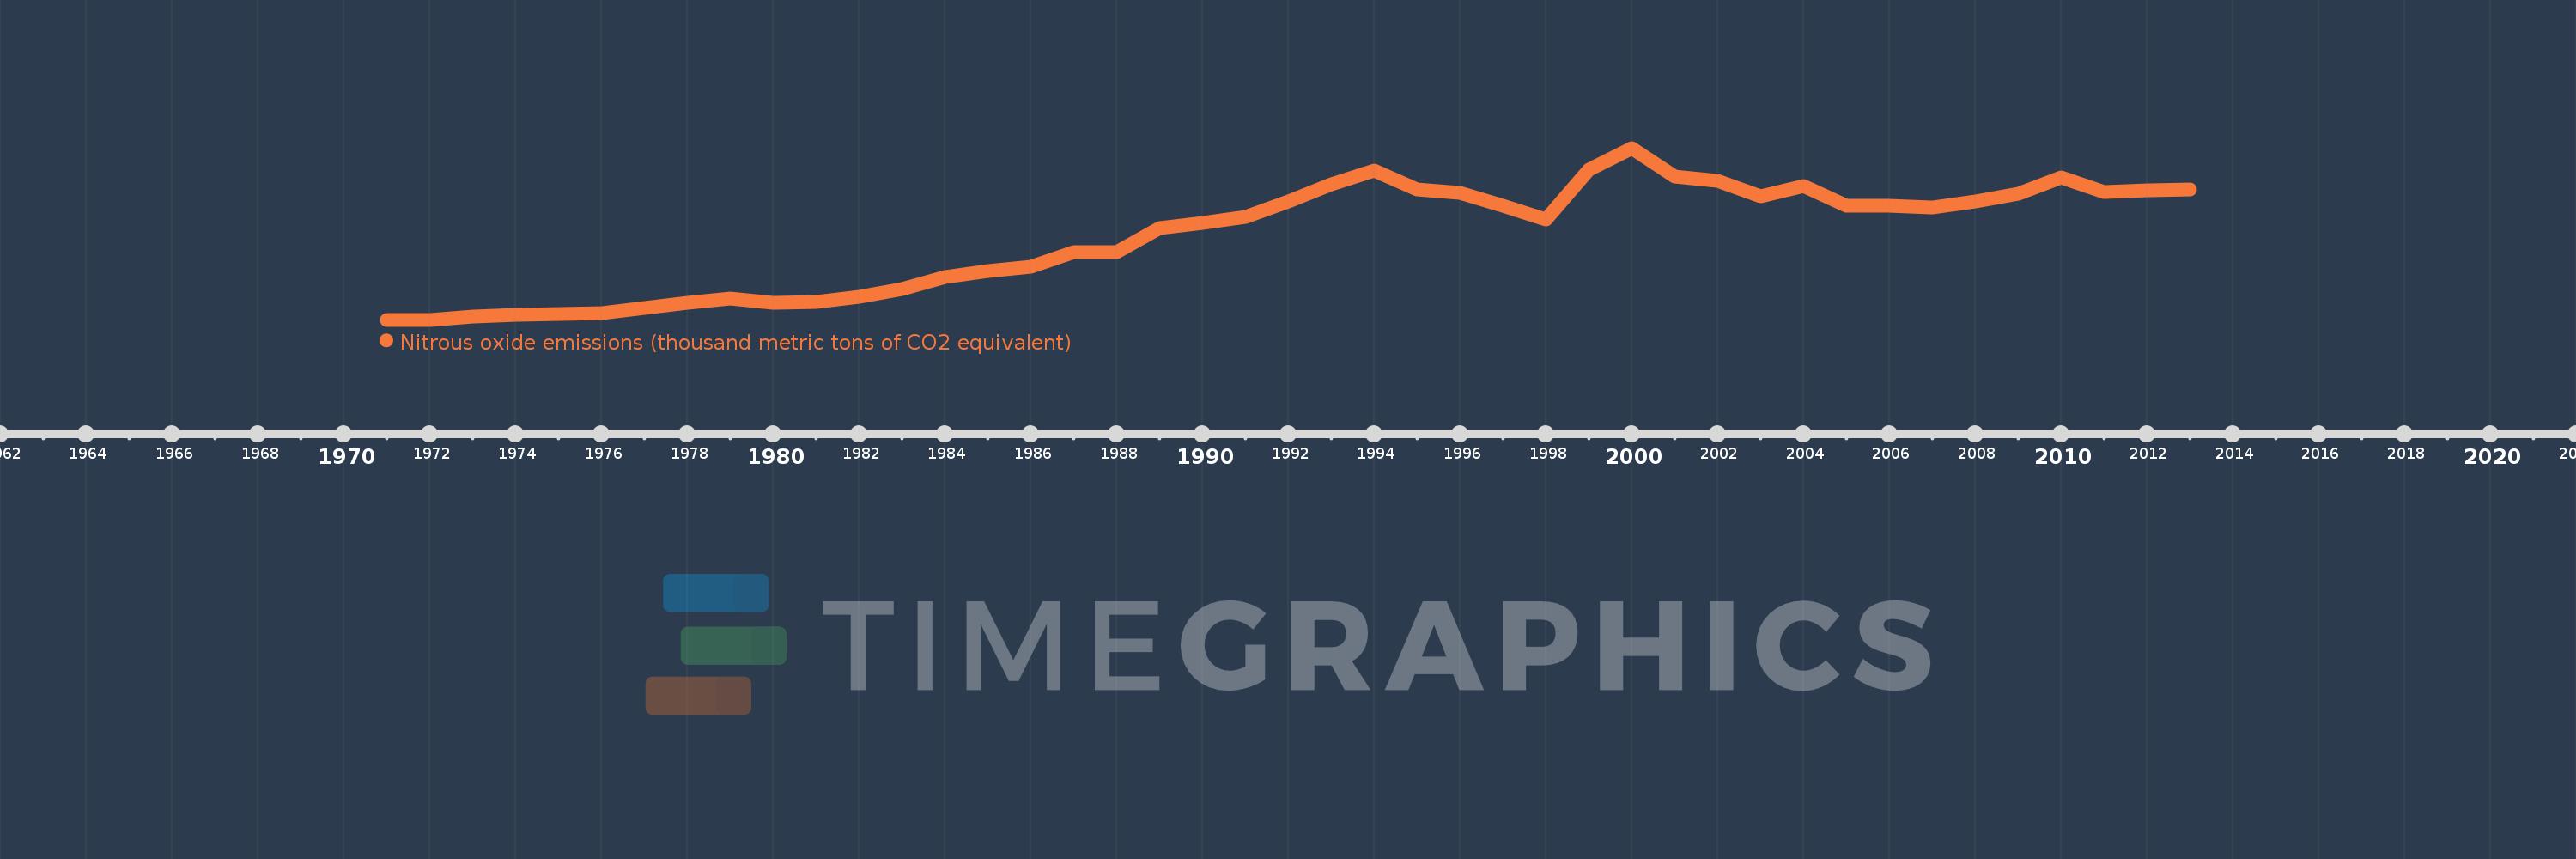
Nitrous oxide emissions (thousand metric tons of CO2 equivalent)
2013,2012,2011,2010,2009,2008,2007,2006,2005,2004,2003,2002,2001,2000,1999,1998,1997,1996,1995,1994,1993,1992,1991,1990,1989,1988,1987,1986,1985,1984,1983,1982,1981,1980,1979,1978,1977,1976,1975,1974,1973,1972,1971
This statistics in other country:
AfghanistanAlbaniaAlgeriaAmerican SamoaAndorraAngolaAntigua and BarbudaArab WorldArgentinaArmeniaArubaAustraliaAustriaAzerbaijanBahamas, TheBahrainBangladeshBarbadosBelarusBelgiumBelizeBeninBermudaBhutanBoliviaBosnia and HerzegovinaBotswanaBrazilBritish Virgin IslandsBrunei DarussalamBulgariaBurkina FasoBurundiCabo VerdeCambodiaCameroonCanadaCaribbean small statesCayman IslandsCentral African RepublicCentral Europe and the BalticsChadChileChinaColombiaComorosCongo, Dem. Rep.Congo, Rep.Costa RicaCote d'IvoireCroatiaCubaCyprusCzech RepublicDenmarkDjiboutiDominicaDominican RepublicEarly-demographic dividendEast Asia & PacificEast Asia & Pacific (excluding high income)East Asia & Pacific (IDA & IBRD countries)EcuadorEgypt, Arab Rep.El SalvadorEquatorial GuineaEritreaEstoniaEthiopiaEuro areaEurope & Central AsiaEurope & Central Asia (excluding high income)Europe & Central Asia (IDA & IBRD countries)European UnionFaroe IslandsFijiFinlandFragile and conflict affected situationsFranceFrench PolynesiaGabonGambia, TheGeorgiaGermanyGhanaGibraltarGreeceGreenlandGrenadaGuamGuatemalaGuineaGuinea-BissauGuyanaHaitiHeavily indebted poor countries (HIPC)High incomeHondurasHong Kong SAR, ChinaHungaryIBRD onlyIcelandIDA & IBRD totalIDA blendIDA onlyIDA totalIndiaIndonesiaIran, Islamic Rep.IraqIrelandIsraelItalyJamaicaJapanJordanKazakhstanKenyaKiribatiKorea, Dem. People’s Rep.Korea, Rep.KosovoKuwaitKyrgyz RepublicLao PDRLate-demographic dividendLatin America & Caribbean Latin America & Caribbean (excluding high income)Latin America & the Caribbean (IDA & IBRD countries)LatviaLeast developed countries: UN classificationLebanonLesothoLiberiaLibyaLithuaniaLow & middle incomeLow incomeLower middle incomeLuxembourgMacao SAR, ChinaMacedonia, FYRMadagascarMalawiMalaysiaMaldivesMaliMaltaMarshall IslandsMauritaniaMauritiusMexicoMicronesia, Fed. Sts.Middle East & North AfricaMiddle East & North Africa (excluding high income)Middle East & North Africa (IDA & IBRD countries)Middle incomeMoldovaMongoliaMontenegroMoroccoMozambiqueMyanmarNamibiaNauruNepalNetherlandsNew CaledoniaNew ZealandNicaraguaNigerNigeriaNorth AmericaNorthern Mariana IslandsNorwayOECD membersOmanOther small statesPacific island small statesPakistanPalauPanamaPapua New GuineaParaguayPeruPhilippinesPolandPortugalPost-demographic dividendPre-demographic dividendPuerto RicoQatarRomaniaRussian FederationRwandaSamoaSao Tome and PrincipeSaudi ArabiaSenegalSerbiaSeychellesSierra LeoneSingaporeSlovak RepublicSloveniaSmall statesSolomon IslandsSomaliaSouth AfricaSouth AsiaSouth Asia (IDA & IBRD)SpainSri LankaSt. Kitts and NevisSt. LuciaSt. Vincent and the GrenadinesSub-Saharan Africa Sub-Saharan Africa (excluding high income)Sub-Saharan Africa (IDA & IBRD countries)SudanSurinameSwazilandSwedenSwitzerlandSyrian Arab RepublicTajikistanTanzaniaThailandTimor-LesteTogoTongaTrinidad and TobagoTunisiaTurkeyTurkmenistanTurks and Caicos IslandsTuvaluUgandaUkraineUnited Arab EmiratesUnited KingdomUnited StatesUpper middle incomeUruguayUzbekistanVanuatuVenezuela, RBVietnamVirgin Islands (U.S.)WorldYemen, Rep.ZambiaZimbabwe Timeline:
This timeline shows a graph from 1971 to 2013 of Hong Kong SAR, China. No data until 1970. Number of actual observations by date: 43.
Source name:
World Development Indicators
Source organization:
European Commission, Joint Research Centre (JRC)/Netherlands Environmental Assessment Agency (PBL). Emission Database for Global Atmospheric Research (EDGAR): http://edgar.jrc.ec.europa.eu/
Categories, topics:
Climate Change, Environment
Last updated:
apr 23, 2017
Indicators value changes by year
Minimum:
102.633
jan 1, 1971
Maximum:
594.016
jan 1, 2000
At the date of observation
Value
Absolute change
Change from previous value
jan 1, 1971
102.633
+102.633
0.0%
jan 1, 1972
102.758
+0.126
0.12%
jan 1, 1973
112.674
+9.915
9.65%
jan 1, 1974
115.876
+3.203
2.84%
jan 1, 1975
118.757
+2.881
2.49%
jan 1, 1976
120.561
+1.804
1.52%
jan 1, 1977
136.427
+15.865
13.16%
jan 1, 1978
150.06
+13.633
9.99%
jan 1, 1979
162.987
+12.928
8.62%
jan 1, 1980
151.408
-11.579
-7.1%
jan 1, 1981
153.177
+1.768
1.17%
jan 1, 1982
169.355
+16.178
10.56%
jan 1, 1983
190.714
+21.359
12.61%
jan 1, 1984
224.13
+33.417
17.52%
jan 1, 1985
243.148
+19.017
8.48%
jan 1, 1986
253.752
+10.605
4.36%
jan 1, 1987
295.306
+41.554
16.38%
jan 1, 1988
295.72
+0.414
0.14%
jan 1, 1989
365.766
+70.046
23.69%
jan 1, 1990
378.572
+12.806
3.5%
jan 1, 1991
396.859
+18.287
4.83%
jan 1, 1992
440.222
+43.363
10.93%
jan 1, 1993
490.457
+50.236
11.41%
jan 1, 1994
529.579
+39.122
7.98%
jan 1, 1995
474.328
-55.251
-10.43%
jan 1, 1996
466.314
-8.014
-1.69%
jan 1, 1997
429.517
-36.797
-7.89%
jan 1, 1998
390.575
-38.942
-9.07%
jan 1, 1999
531.018
+140.442
35.96%
jan 1, 2000
594.016
+62.998
11.86%
jan 1, 2001
513.258
-80.758
-13.6%
jan 1, 2002
498.725
-14.533
-2.83%
jan 1, 2003
455.495
-43.229
-8.67%
jan 1, 2004
484.22
+28.725
6.31%
jan 1, 2005
427.636
-56.584
-11.69%
jan 1, 2006
427.94
+0.304
0.07%
jan 1, 2007
424.716
-3.224
-0.75%
jan 1, 2008
441.865
+17.149
4.04%
jan 1, 2009
462.474
+20.609
4.66%
jan 1, 2010
510.105
+47.632
10.3%
jan 1, 2011
467.114
-42.991
-8.43%
jan 1, 2012
471.785
+4.671
1.0%
jan 1, 2013
476.456
+4.671
0.99%
Ranking of countries by current statistics by years


Comments: