29
/
en
AIzaSyAYiBZKx7MnpbEhh9jyipgxe19OcubqV5w
April 1, 2024
30993
Europe & Central Asia
ECS
false
2
1
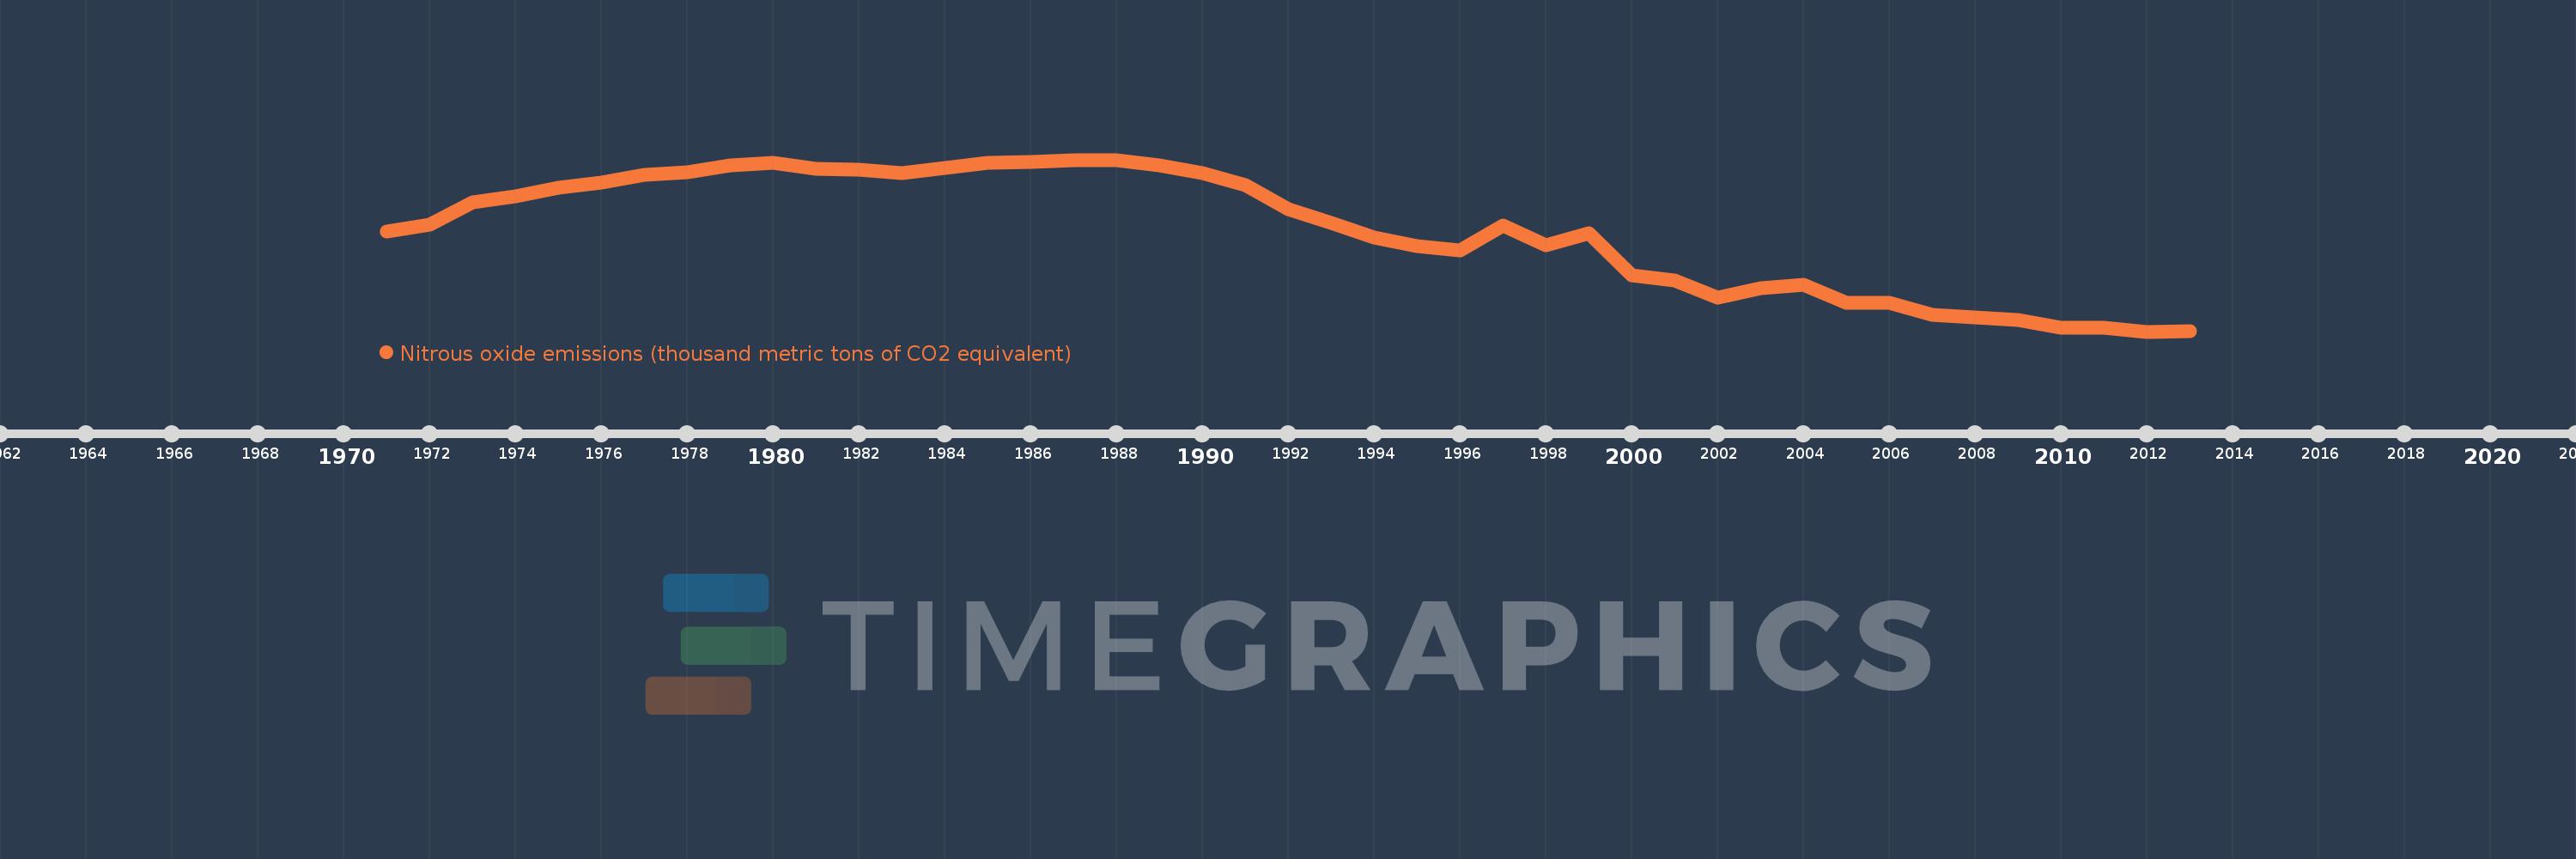
Nitrous oxide emissions (thousand metric tons of CO2 equivalent)
2013,2012,2011,2010,2009,2008,2007,2006,2005,2004,2003,2002,2001,2000,1999,1998,1997,1996,1995,1994,1993,1992,1991,1990,1989,1988,1987,1986,1985,1984,1983,1982,1981,1980,1979,1978,1977,1976,1975,1974,1973,1972,1971
This statistics in other country:
AfghanistanAlbaniaAlgeriaAmerican SamoaAndorraAngolaAntigua and BarbudaArab WorldArgentinaArmeniaArubaAustraliaAustriaAzerbaijanBahamas, TheBahrainBangladeshBarbadosBelarusBelgiumBelizeBeninBermudaBhutanBoliviaBosnia and HerzegovinaBotswanaBrazilBritish Virgin IslandsBrunei DarussalamBulgariaBurkina FasoBurundiCabo VerdeCambodiaCameroonCanadaCaribbean small statesCayman IslandsCentral African RepublicCentral Europe and the BalticsChadChileChinaColombiaComorosCongo, Dem. Rep.Congo, Rep.Costa RicaCote d'IvoireCroatiaCubaCyprusCzech RepublicDenmarkDjiboutiDominicaDominican RepublicEarly-demographic dividendEast Asia & PacificEast Asia & Pacific (excluding high income)East Asia & Pacific (IDA & IBRD countries)EcuadorEgypt, Arab Rep.El SalvadorEquatorial GuineaEritreaEstoniaEthiopiaEuro areaEurope & Central AsiaEurope & Central Asia (excluding high income)Europe & Central Asia (IDA & IBRD countries)European UnionFaroe IslandsFijiFinlandFragile and conflict affected situationsFranceFrench PolynesiaGabonGambia, TheGeorgiaGermanyGhanaGibraltarGreeceGreenlandGrenadaGuamGuatemalaGuineaGuinea-BissauGuyanaHaitiHeavily indebted poor countries (HIPC)High incomeHondurasHong Kong SAR, ChinaHungaryIBRD onlyIcelandIDA & IBRD totalIDA blendIDA onlyIDA totalIndiaIndonesiaIran, Islamic Rep.IraqIrelandIsraelItalyJamaicaJapanJordanKazakhstanKenyaKiribatiKorea, Dem. People’s Rep.Korea, Rep.KosovoKuwaitKyrgyz RepublicLao PDRLate-demographic dividendLatin America & Caribbean Latin America & Caribbean (excluding high income)Latin America & the Caribbean (IDA & IBRD countries)LatviaLeast developed countries: UN classificationLebanonLesothoLiberiaLibyaLithuaniaLow & middle incomeLow incomeLower middle incomeLuxembourgMacao SAR, ChinaMacedonia, FYRMadagascarMalawiMalaysiaMaldivesMaliMaltaMarshall IslandsMauritaniaMauritiusMexicoMicronesia, Fed. Sts.Middle East & North AfricaMiddle East & North Africa (excluding high income)Middle East & North Africa (IDA & IBRD countries)Middle incomeMoldovaMongoliaMontenegroMoroccoMozambiqueMyanmarNamibiaNauruNepalNetherlandsNew CaledoniaNew ZealandNicaraguaNigerNigeriaNorth AmericaNorthern Mariana IslandsNorwayOECD membersOmanOther small statesPacific island small statesPakistanPalauPanamaPapua New GuineaParaguayPeruPhilippinesPolandPortugalPost-demographic dividendPre-demographic dividendPuerto RicoQatarRomaniaRussian FederationRwandaSamoaSao Tome and PrincipeSaudi ArabiaSenegalSerbiaSeychellesSierra LeoneSingaporeSlovak RepublicSloveniaSmall statesSolomon IslandsSomaliaSouth AfricaSouth AsiaSouth Asia (IDA & IBRD)SpainSri LankaSt. Kitts and NevisSt. LuciaSt. Vincent and the GrenadinesSub-Saharan Africa Sub-Saharan Africa (excluding high income)Sub-Saharan Africa (IDA & IBRD countries)SudanSurinameSwazilandSwedenSwitzerlandSyrian Arab RepublicTajikistanTanzaniaThailandTimor-LesteTogoTongaTrinidad and TobagoTunisiaTurkeyTurkmenistanTurks and Caicos IslandsTuvaluUgandaUkraineUnited Arab EmiratesUnited KingdomUnited StatesUpper middle incomeUruguayUzbekistanVanuatuVenezuela, RBVietnamVirgin Islands (U.S.)WorldYemen, Rep.ZambiaZimbabwe Timeline:
This timeline shows a graph from 1971 to 2013 of Europe & Central Asia. No data until 1970. Number of actual observations by date: 43.
Source name:
World Development Indicators
Source organization:
European Commission, Joint Research Centre (JRC)/Netherlands Environmental Assessment Agency (PBL). Emission Database for Global Atmospheric Research (EDGAR): http://edgar.jrc.ec.europa.eu/
Categories, topics:
Climate Change, Environment
Last updated:
apr 23, 2017
Indicators value changes by year
Minimum:
458.032K
jan 1, 2012
Maximum:
835.1K
jan 1, 1988
At the date of observation
Value
Absolute change
Change from previous value
jan 1, 1971
678.09K
+678.09K
0.0%
jan 1, 1972
693.231K
+15.141K
2.23%
jan 1, 1973
741.278K
+48.047K
6.93%
jan 1, 1974
754.913K
+13.635K
1.84%
jan 1, 1975
774.362K
+19.449K
2.58%
jan 1, 1976
784.312K
+9.951K
1.29%
jan 1, 1977
802.268K
+17.956K
2.29%
jan 1, 1978
808.076K
+5.808K
0.72%
jan 1, 1979
823.171K
+15.095K
1.87%
jan 1, 1980
829.207K
+6.036K
0.73%
jan 1, 1981
816.032K
-13.175K
-1.59%
jan 1, 1982
813.487K
-2.545K
-0.31%
jan 1, 1983
806.21K
-7.277K
-0.89%
jan 1, 1984
817.118K
+10.908K
1.35%
jan 1, 1985
829.176K
+12.058K
1.48%
jan 1, 1986
830.007K
+831.675
0.1%
jan 1, 1987
835.088K
+5.08K
0.61%
jan 1, 1988
835.1K
+11.737
0.0%
jan 1, 1989
823.22K
-11.88K
-1.42%
jan 1, 1990
805.973K
-17.246K
-2.09%
jan 1, 1991
779.545K
-26.428K
-3.28%
jan 1, 1992
726.787K
-52.758K
-6.77%
jan 1, 1993
696.654K
-30.133K
-4.15%
jan 1, 1994
664.993K
-31.661K
-4.54%
jan 1, 1995
646.075K
-18.918K
-2.84%
jan 1, 1996
636.775K
-9.3K
-1.44%
jan 1, 1997
691.516K
+54.741K
8.6%
jan 1, 1998
647.087K
-44.429K
-6.42%
jan 1, 1999
673.246K
+26.159K
4.04%
jan 1, 2000
582.198K
-91.048K
-13.52%
jan 1, 2001
570.277K
-11.921K
-2.05%
jan 1, 2002
531.812K
-38.465K
-6.75%
jan 1, 2003
552.912K
+21.1K
3.97%
jan 1, 2004
561.255K
+8.344K
1.51%
jan 1, 2005
520.381K
-40.875K
-7.28%
jan 1, 2006
520.918K
+537.134
0.1%
jan 1, 2007
494.049K
-26.869K
-5.16%
jan 1, 2008
488.772K
-5.278K
-1.07%
jan 1, 2009
482.984K
-5.788K
-1.18%
jan 1, 2010
465.942K
-17.042K
-3.53%
jan 1, 2011
467.156K
+1.215K
0.26%
jan 1, 2012
458.032K
-9.125K
-1.95%
jan 1, 2013
458.268K
+236.665
0.05%
Ranking of countries by current statistics by years


Comments: