29
/
en
AIzaSyAYiBZKx7MnpbEhh9jyipgxe19OcubqV5w
April 1, 2024
215634
Oman
OMN
true
2
1
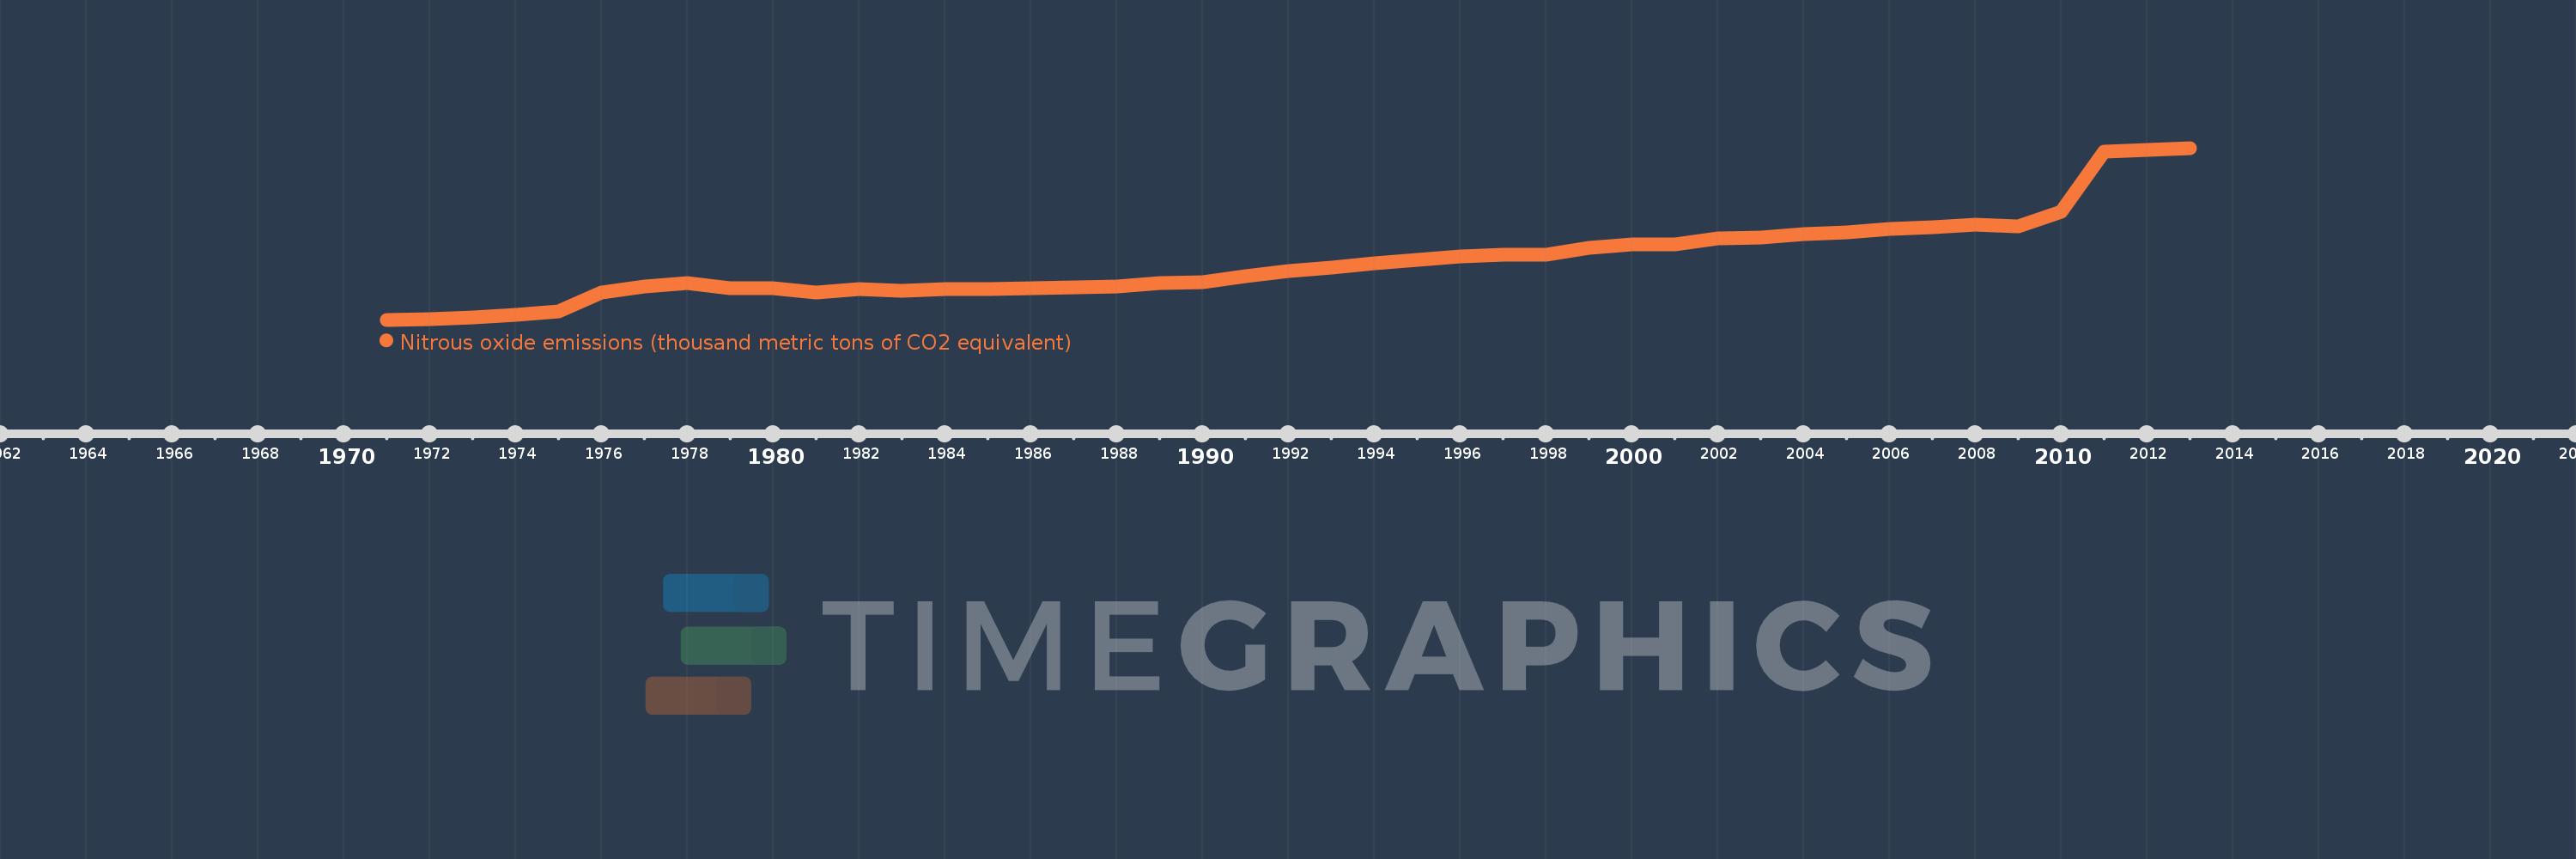
Nitrous oxide emissions (thousand metric tons of CO2 equivalent)
2013,2012,2011,2010,2009,2008,2007,2006,2005,2004,2003,2002,2001,2000,1999,1998,1997,1996,1995,1994,1993,1992,1991,1990,1989,1988,1987,1986,1985,1984,1983,1982,1981,1980,1979,1978,1977,1976,1975,1974,1973,1972,1971
This statistics in other country:
AfghanistanAlbaniaAlgeriaAmerican SamoaAndorraAngolaAntigua and BarbudaArab WorldArgentinaArmeniaArubaAustraliaAustriaAzerbaijanBahamas, TheBahrainBangladeshBarbadosBelarusBelgiumBelizeBeninBermudaBhutanBoliviaBosnia and HerzegovinaBotswanaBrazilBritish Virgin IslandsBrunei DarussalamBulgariaBurkina FasoBurundiCabo VerdeCambodiaCameroonCanadaCaribbean small statesCayman IslandsCentral African RepublicCentral Europe and the BalticsChadChileChinaColombiaComorosCongo, Dem. Rep.Congo, Rep.Costa RicaCote d'IvoireCroatiaCubaCyprusCzech RepublicDenmarkDjiboutiDominicaDominican RepublicEarly-demographic dividendEast Asia & PacificEast Asia & Pacific (excluding high income)East Asia & Pacific (IDA & IBRD countries)EcuadorEgypt, Arab Rep.El SalvadorEquatorial GuineaEritreaEstoniaEthiopiaEuro areaEurope & Central AsiaEurope & Central Asia (excluding high income)Europe & Central Asia (IDA & IBRD countries)European UnionFaroe IslandsFijiFinlandFragile and conflict affected situationsFranceFrench PolynesiaGabonGambia, TheGeorgiaGermanyGhanaGibraltarGreeceGreenlandGrenadaGuamGuatemalaGuineaGuinea-BissauGuyanaHaitiHeavily indebted poor countries (HIPC)High incomeHondurasHong Kong SAR, ChinaHungaryIBRD onlyIcelandIDA & IBRD totalIDA blendIDA onlyIDA totalIndiaIndonesiaIran, Islamic Rep.IraqIrelandIsraelItalyJamaicaJapanJordanKazakhstanKenyaKiribatiKorea, Dem. People’s Rep.Korea, Rep.KosovoKuwaitKyrgyz RepublicLao PDRLate-demographic dividendLatin America & Caribbean Latin America & Caribbean (excluding high income)Latin America & the Caribbean (IDA & IBRD countries)LatviaLeast developed countries: UN classificationLebanonLesothoLiberiaLibyaLithuaniaLow & middle incomeLow incomeLower middle incomeLuxembourgMacao SAR, ChinaMacedonia, FYRMadagascarMalawiMalaysiaMaldivesMaliMaltaMarshall IslandsMauritaniaMauritiusMexicoMicronesia, Fed. Sts.Middle East & North AfricaMiddle East & North Africa (excluding high income)Middle East & North Africa (IDA & IBRD countries)Middle incomeMoldovaMongoliaMontenegroMoroccoMozambiqueMyanmarNamibiaNauruNepalNetherlandsNew CaledoniaNew ZealandNicaraguaNigerNigeriaNorth AmericaNorthern Mariana IslandsNorwayOECD membersOmanOther small statesPacific island small statesPakistanPalauPanamaPapua New GuineaParaguayPeruPhilippinesPolandPortugalPost-demographic dividendPre-demographic dividendPuerto RicoQatarRomaniaRussian FederationRwandaSamoaSao Tome and PrincipeSaudi ArabiaSenegalSerbiaSeychellesSierra LeoneSingaporeSlovak RepublicSloveniaSmall statesSolomon IslandsSomaliaSouth AfricaSouth AsiaSouth Asia (IDA & IBRD)SpainSri LankaSt. Kitts and NevisSt. LuciaSt. Vincent and the GrenadinesSub-Saharan Africa Sub-Saharan Africa (excluding high income)Sub-Saharan Africa (IDA & IBRD countries)SudanSurinameSwazilandSwedenSwitzerlandSyrian Arab RepublicTajikistanTanzaniaThailandTimor-LesteTogoTongaTrinidad and TobagoTunisiaTurkeyTurkmenistanTurks and Caicos IslandsTuvaluUgandaUkraineUnited Arab EmiratesUnited KingdomUnited StatesUpper middle incomeUruguayUzbekistanVanuatuVenezuela, RBVietnamVirgin Islands (U.S.)WorldYemen, Rep.ZambiaZimbabwe Timeline:
This timeline shows a graph from 1971 to 2013 of Oman. No data until 1970. Number of actual observations by date: 43.
Source name:
World Development Indicators
Source organization:
European Commission, Joint Research Centre (JRC)/Netherlands Environmental Assessment Agency (PBL). Emission Database for Global Atmospheric Research (EDGAR): http://edgar.jrc.ec.europa.eu/
Categories, topics:
Climate Change, Environment
Last updated:
apr 23, 2017
Indicators value changes by year
Minimum:
129.38
jan 1, 1971
Maximum:
1.146K
jan 1, 2013
At the date of observation
Value
Absolute change
Change from previous value
jan 1, 1971
129.38
+129.38
0.0%
jan 1, 1972
133.579
+4.198
3.24%
jan 1, 1973
144.286
+10.707
8.02%
jan 1, 1974
157.59
+13.304
9.22%
jan 1, 1975
178.699
+21.109
13.39%
jan 1, 1976
290.42
+111.722
62.52%
jan 1, 1977
323.625
+33.204
11.43%
jan 1, 1978
346.041
+22.416
6.93%
jan 1, 1979
318.494
-27.547
-7.96%
jan 1, 1980
316.25
-2.244
-0.7%
jan 1, 1981
289.899
-26.351
-8.33%
jan 1, 1982
311.869
+21.971
7.58%
jan 1, 1983
301.344
-10.525
-3.37%
jan 1, 1984
312.725
+11.38
3.78%
jan 1, 1985
309.562
-3.163
-1.01%
jan 1, 1986
314.839
+5.277
1.7%
jan 1, 1987
322.927
+8.088
2.57%
jan 1, 1988
326.601
+3.673
1.14%
jan 1, 1989
345.411
+18.811
5.76%
jan 1, 1990
349.296
+3.884
1.12%
jan 1, 1991
388.194
+38.899
11.14%
jan 1, 1992
415.341
+27.147
6.99%
jan 1, 1993
440.333
+24.992
6.02%
jan 1, 1994
462.359
+22.025
5.0%
jan 1, 1995
483.085
+20.727
4.48%
jan 1, 1996
504.271
+21.185
4.39%
jan 1, 1997
512.16
+7.889
1.56%
jan 1, 1998
516.817
+4.656
0.91%
jan 1, 1999
555.666
+38.849
7.52%
jan 1, 2000
576.061
+20.395
3.67%
jan 1, 2001
573.438
-2.623
-0.46%
jan 1, 2002
609.99
+36.552
6.37%
jan 1, 2003
615.707
+5.716
0.94%
jan 1, 2004
637.788
+22.081
3.59%
jan 1, 2005
646.195
+8.407
1.32%
jan 1, 2006
666.463
+20.268
3.14%
jan 1, 2007
678.596
+12.133
1.82%
jan 1, 2008
691.393
+12.797
1.89%
jan 1, 2009
679.771
-11.622
-1.68%
jan 1, 2010
769.811
+90.039
13.25%
jan 1, 2011
1.124K
+353.989
45.98%
jan 1, 2012
1.135K
+11.238
1.0%
jan 1, 2013
1.146K
+11.238
0.99%
Ranking of countries by current statistics by years


Comments: