29
/
en
AIzaSyAYiBZKx7MnpbEhh9jyipgxe19OcubqV5w
April 1, 2024
276006
United Kingdom
GBR
true
2
1
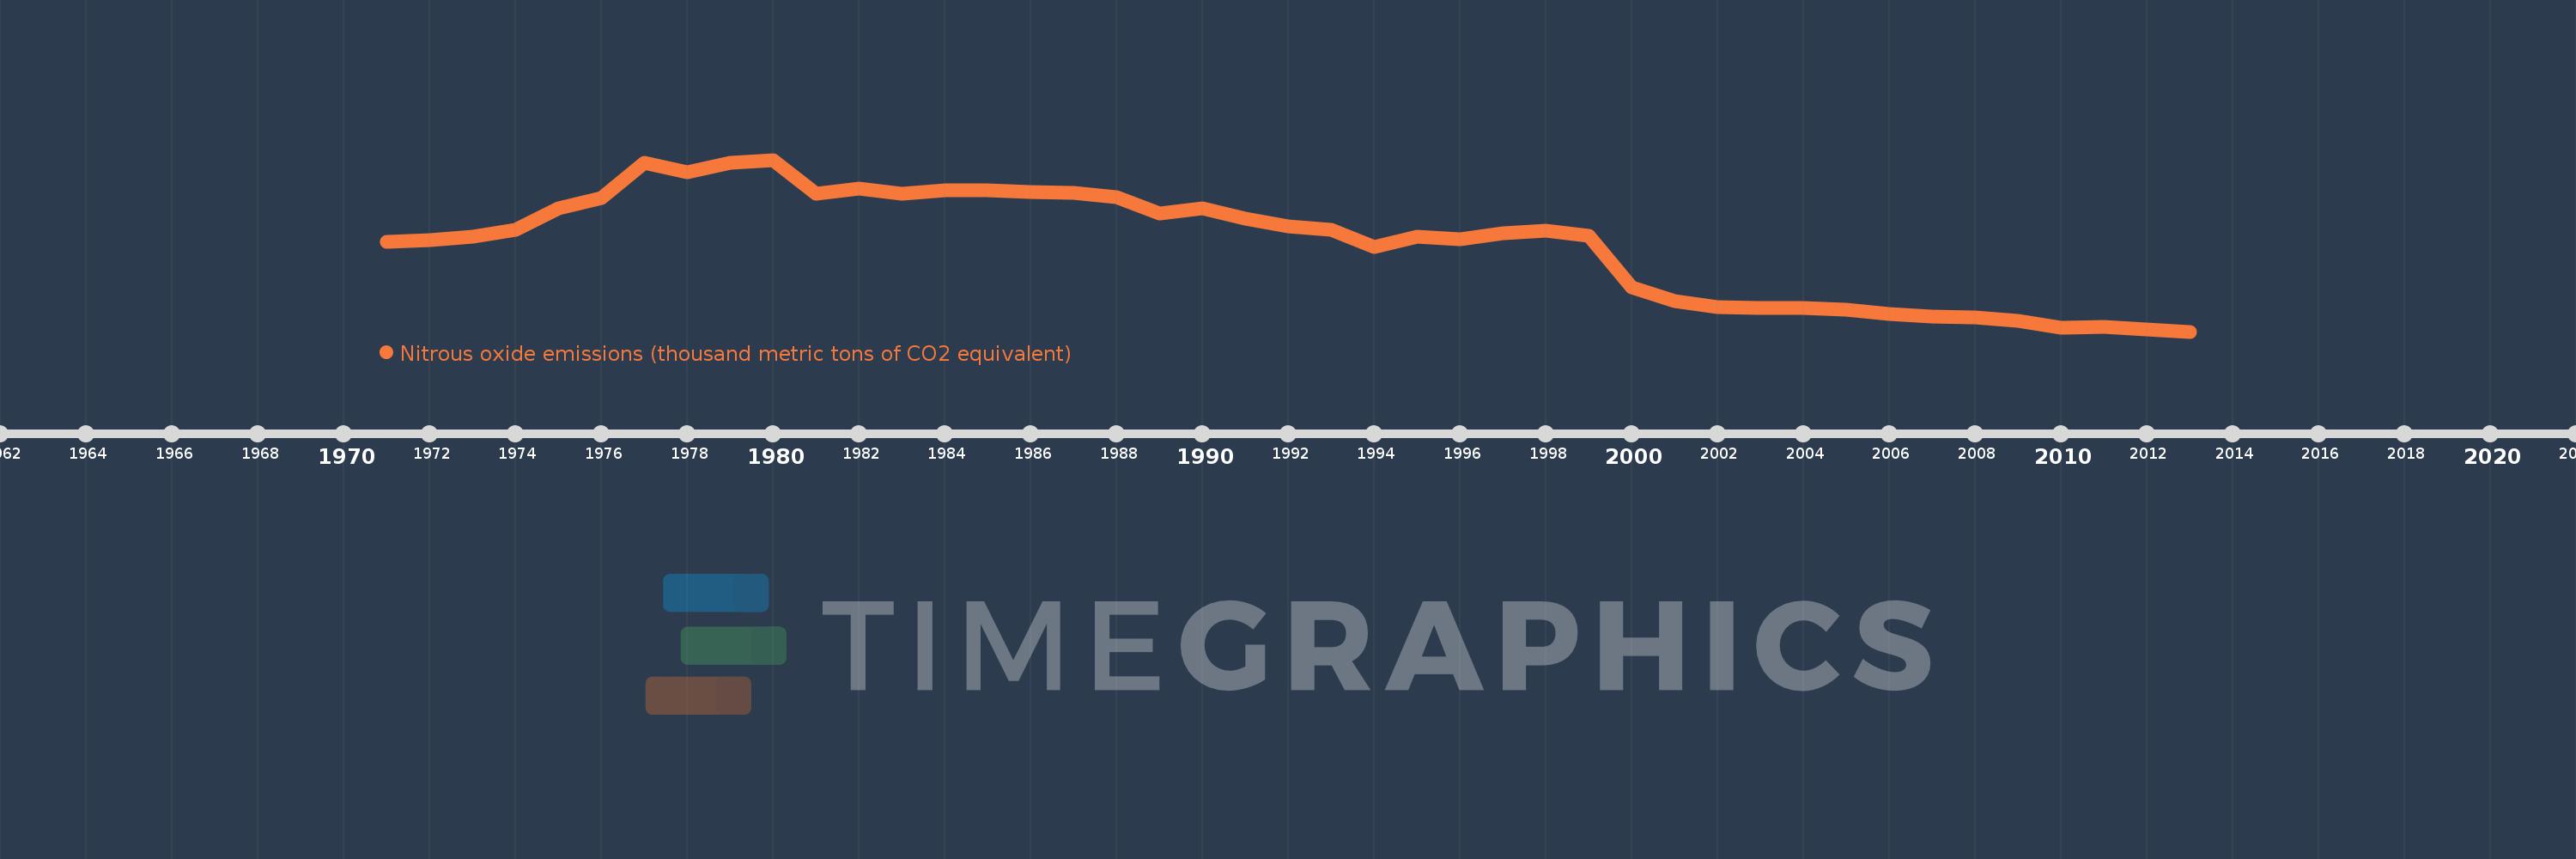
Nitrous oxide emissions (thousand metric tons of CO2 equivalent)
2013,2012,2011,2010,2009,2008,2007,2006,2005,2004,2003,2002,2001,2000,1999,1998,1997,1996,1995,1994,1993,1992,1991,1990,1989,1988,1987,1986,1985,1984,1983,1982,1981,1980,1979,1978,1977,1976,1975,1974,1973,1972,1971
This statistics in other country:
AfghanistanAlbaniaAlgeriaAmerican SamoaAndorraAngolaAntigua and BarbudaArab WorldArgentinaArmeniaArubaAustraliaAustriaAzerbaijanBahamas, TheBahrainBangladeshBarbadosBelarusBelgiumBelizeBeninBermudaBhutanBoliviaBosnia and HerzegovinaBotswanaBrazilBritish Virgin IslandsBrunei DarussalamBulgariaBurkina FasoBurundiCabo VerdeCambodiaCameroonCanadaCaribbean small statesCayman IslandsCentral African RepublicCentral Europe and the BalticsChadChileChinaColombiaComorosCongo, Dem. Rep.Congo, Rep.Costa RicaCote d'IvoireCroatiaCubaCyprusCzech RepublicDenmarkDjiboutiDominicaDominican RepublicEarly-demographic dividendEast Asia & PacificEast Asia & Pacific (excluding high income)East Asia & Pacific (IDA & IBRD countries)EcuadorEgypt, Arab Rep.El SalvadorEquatorial GuineaEritreaEstoniaEthiopiaEuro areaEurope & Central AsiaEurope & Central Asia (excluding high income)Europe & Central Asia (IDA & IBRD countries)European UnionFaroe IslandsFijiFinlandFragile and conflict affected situationsFranceFrench PolynesiaGabonGambia, TheGeorgiaGermanyGhanaGibraltarGreeceGreenlandGrenadaGuamGuatemalaGuineaGuinea-BissauGuyanaHaitiHeavily indebted poor countries (HIPC)High incomeHondurasHong Kong SAR, ChinaHungaryIBRD onlyIcelandIDA & IBRD totalIDA blendIDA onlyIDA totalIndiaIndonesiaIran, Islamic Rep.IraqIrelandIsraelItalyJamaicaJapanJordanKazakhstanKenyaKiribatiKorea, Dem. People’s Rep.Korea, Rep.KosovoKuwaitKyrgyz RepublicLao PDRLate-demographic dividendLatin America & Caribbean Latin America & Caribbean (excluding high income)Latin America & the Caribbean (IDA & IBRD countries)LatviaLeast developed countries: UN classificationLebanonLesothoLiberiaLibyaLithuaniaLow & middle incomeLow incomeLower middle incomeLuxembourgMacao SAR, ChinaMacedonia, FYRMadagascarMalawiMalaysiaMaldivesMaliMaltaMarshall IslandsMauritaniaMauritiusMexicoMicronesia, Fed. Sts.Middle East & North AfricaMiddle East & North Africa (excluding high income)Middle East & North Africa (IDA & IBRD countries)Middle incomeMoldovaMongoliaMontenegroMoroccoMozambiqueMyanmarNamibiaNauruNepalNetherlandsNew CaledoniaNew ZealandNicaraguaNigerNigeriaNorth AmericaNorthern Mariana IslandsNorwayOECD membersOmanOther small statesPacific island small statesPakistanPalauPanamaPapua New GuineaParaguayPeruPhilippinesPolandPortugalPost-demographic dividendPre-demographic dividendPuerto RicoQatarRomaniaRussian FederationRwandaSamoaSao Tome and PrincipeSaudi ArabiaSenegalSerbiaSeychellesSierra LeoneSingaporeSlovak RepublicSloveniaSmall statesSolomon IslandsSomaliaSouth AfricaSouth AsiaSouth Asia (IDA & IBRD)SpainSri LankaSt. Kitts and NevisSt. LuciaSt. Vincent and the GrenadinesSub-Saharan Africa Sub-Saharan Africa (excluding high income)Sub-Saharan Africa (IDA & IBRD countries)SudanSurinameSwazilandSwedenSwitzerlandSyrian Arab RepublicTajikistanTanzaniaThailandTimor-LesteTogoTongaTrinidad and TobagoTunisiaTurkeyTurkmenistanTurks and Caicos IslandsTuvaluUgandaUkraineUnited Arab EmiratesUnited KingdomUnited StatesUpper middle incomeUruguayUzbekistanVanuatuVenezuela, RBVietnamVirgin Islands (U.S.)WorldYemen, Rep.ZambiaZimbabwe Timeline:
This timeline shows a graph from 1971 to 2013 of United Kingdom. No data until 1970. Number of actual observations by date: 43.
Source name:
World Development Indicators
Source organization:
European Commission, Joint Research Centre (JRC)/Netherlands Environmental Assessment Agency (PBL). Emission Database for Global Atmospheric Research (EDGAR): http://edgar.jrc.ec.europa.eu/
Categories, topics:
Climate Change, Environment
Last updated:
apr 23, 2017
Indicators value changes by year
Minimum:
25.335K
jan 1, 2013
Maximum:
73.193K
jan 1, 1980
At the date of observation
Value
Absolute change
Change from previous value
jan 1, 1971
50.31K
+50.31K
0.0%
jan 1, 1972
50.701K
+391.22
0.78%
jan 1, 1973
51.661K
+960.07
1.89%
jan 1, 1974
53.572K
+1.91K
3.7%
jan 1, 1975
59.654K
+6.082K
11.35%
jan 1, 1976
62.652K
+2.998K
5.03%
jan 1, 1977
72.341K
+9.688K
15.46%
jan 1, 1978
69.758K
-2.583K
-3.57%
jan 1, 1979
72.35K
+2.593K
3.72%
jan 1, 1980
73.193K
+843.2
1.17%
jan 1, 1981
63.712K
-9.481K
-12.95%
jan 1, 1982
65.212K
+1.5K
2.35%
jan 1, 1983
63.765K
-1.448K
-2.22%
jan 1, 1984
64.623K
+858.08
1.35%
jan 1, 1985
64.683K
+60.76
0.09%
jan 1, 1986
64.115K
-568.85
-0.88%
jan 1, 1987
63.889K
-225.37
-0.35%
jan 1, 1988
62.792K
-1.097K
-1.72%
jan 1, 1989
58.15K
-4.642K
-7.39%
jan 1, 1990
59.665K
+1.515K
2.6%
jan 1, 1991
56.746K
-2.918K
-4.89%
jan 1, 1992
54.531K
-2.216K
-3.9%
jan 1, 1993
53.779K
-751.75
-1.38%
jan 1, 1994
49.007K
-4.772K
-8.87%
jan 1, 1995
51.691K
+2.684K
5.48%
jan 1, 1996
51.013K
-677.66
-1.31%
jan 1, 1997
52.62K
+1.607K
3.15%
jan 1, 1998
53.567K
+947.36
1.8%
jan 1, 1999
51.947K
-1.62K
-3.02%
jan 1, 2000
37.564K
-14.383K
-27.69%
jan 1, 2001
33.79K
-3.774K
-10.05%
jan 1, 2002
32.203K
-1.587K
-4.7%
jan 1, 2003
31.882K
-320.85
-1.0%
jan 1, 2004
32.021K
+138.57
0.43%
jan 1, 2005
31.472K
-548.7
-1.71%
jan 1, 2006
30.129K
-1.343K
-4.27%
jan 1, 2007
29.557K
-571.95
-1.9%
jan 1, 2008
29.207K
-349.494
-1.18%
jan 1, 2009
28.403K
-804.45
-2.75%
jan 1, 2010
26.422K
-1.981K
-6.97%
jan 1, 2011
26.536K
+114.421
0.43%
jan 1, 2012
25.878K
-657.938
-2.48%
jan 1, 2013
25.335K
-543.517
-2.1%
Ranking of countries by current statistics by years


Comments: