29
/
en
AIzaSyAYiBZKx7MnpbEhh9jyipgxe19OcubqV5w
April 1, 2024
92180
British Virgin Islands
VGB
true
2
1
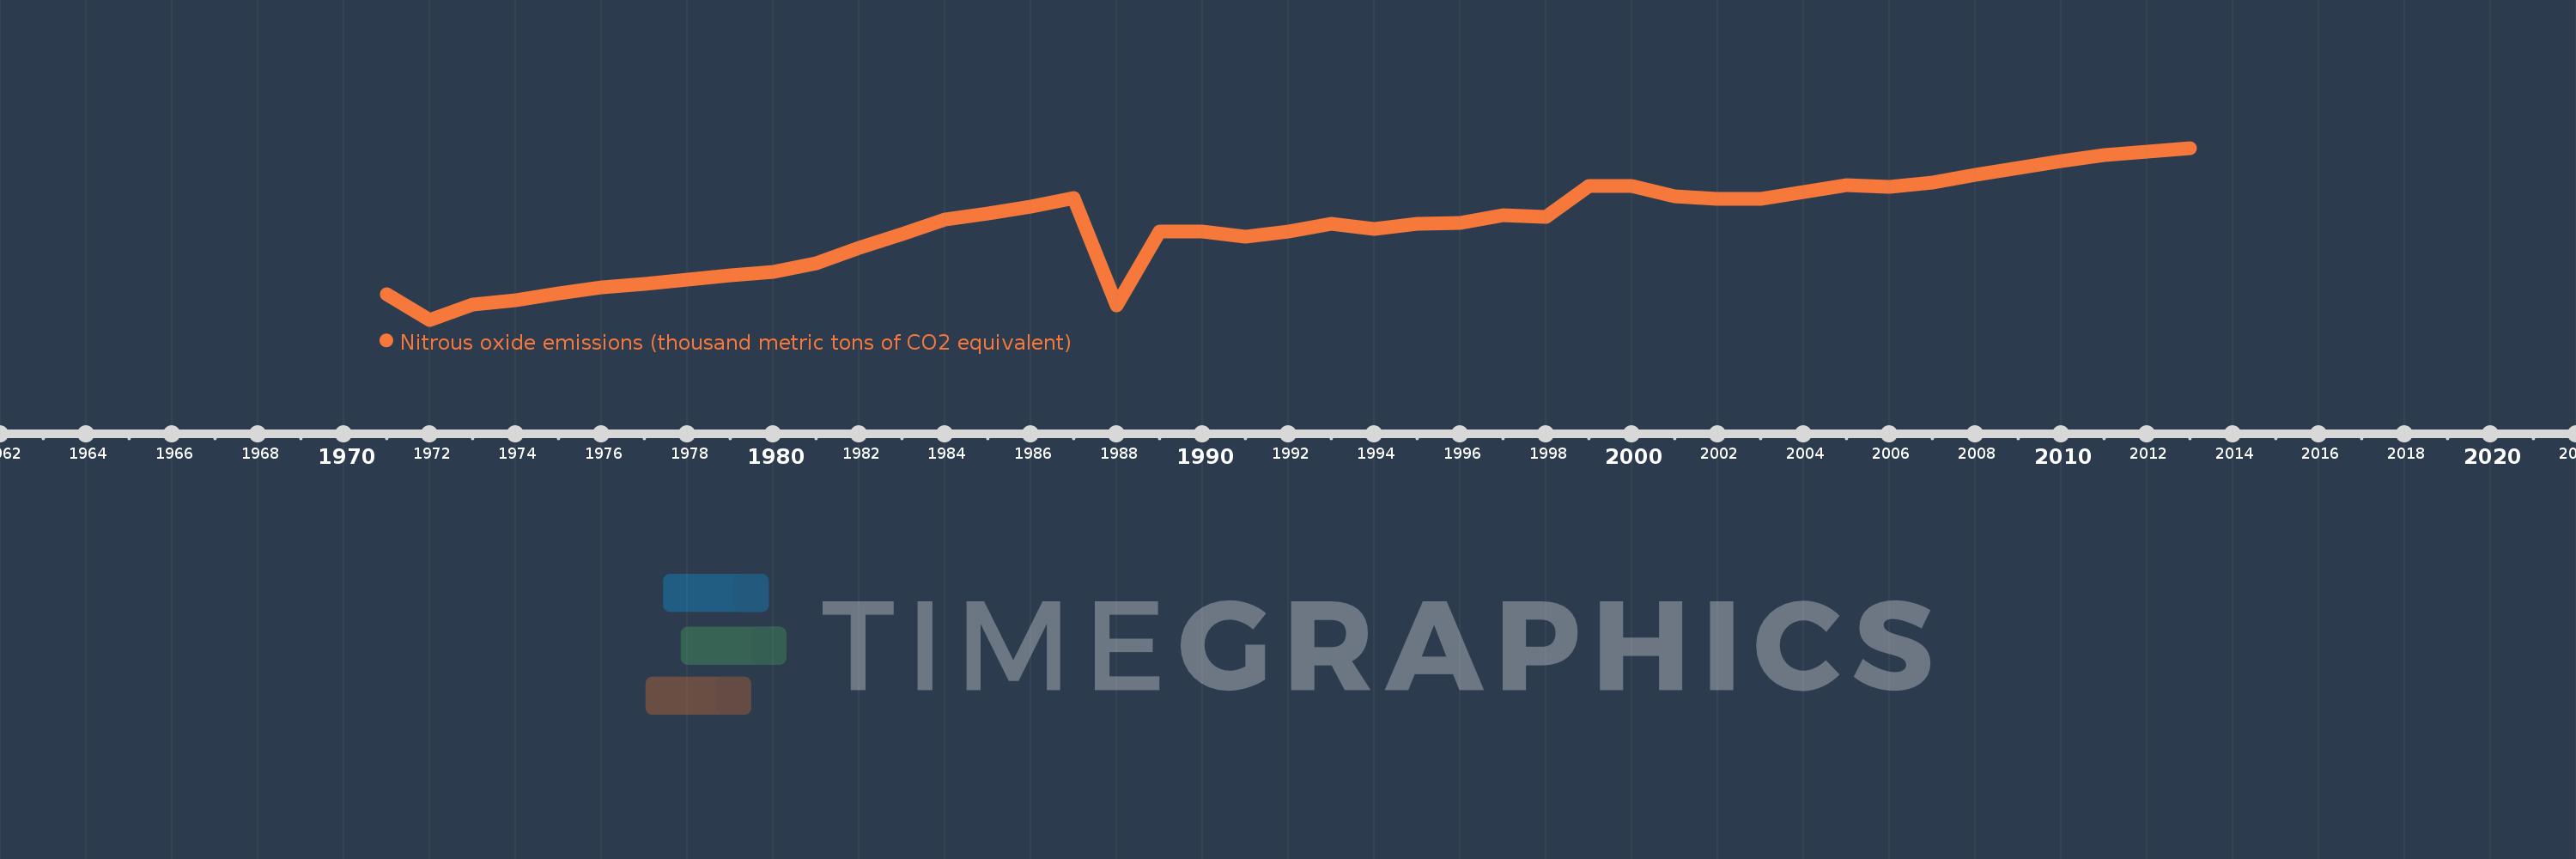
Nitrous oxide emissions (thousand metric tons of CO2 equivalent)
2013,2012,2011,2010,2009,2008,2007,2006,2005,2004,2003,2002,2001,2000,1999,1998,1997,1996,1995,1994,1993,1992,1991,1990,1989,1988,1987,1986,1985,1984,1983,1982,1981,1980,1979,1978,1977,1976,1975,1974,1973,1972,1971
This statistics in other country:
AfghanistanAlbaniaAlgeriaAmerican SamoaAndorraAngolaAntigua and BarbudaArab WorldArgentinaArmeniaArubaAustraliaAustriaAzerbaijanBahamas, TheBahrainBangladeshBarbadosBelarusBelgiumBelizeBeninBermudaBhutanBoliviaBosnia and HerzegovinaBotswanaBrazilBritish Virgin IslandsBrunei DarussalamBulgariaBurkina FasoBurundiCabo VerdeCambodiaCameroonCanadaCaribbean small statesCayman IslandsCentral African RepublicCentral Europe and the BalticsChadChileChinaColombiaComorosCongo, Dem. Rep.Congo, Rep.Costa RicaCote d'IvoireCroatiaCubaCyprusCzech RepublicDenmarkDjiboutiDominicaDominican RepublicEarly-demographic dividendEast Asia & PacificEast Asia & Pacific (excluding high income)East Asia & Pacific (IDA & IBRD countries)EcuadorEgypt, Arab Rep.El SalvadorEquatorial GuineaEritreaEstoniaEthiopiaEuro areaEurope & Central AsiaEurope & Central Asia (excluding high income)Europe & Central Asia (IDA & IBRD countries)European UnionFaroe IslandsFijiFinlandFragile and conflict affected situationsFranceFrench PolynesiaGabonGambia, TheGeorgiaGermanyGhanaGibraltarGreeceGreenlandGrenadaGuamGuatemalaGuineaGuinea-BissauGuyanaHaitiHeavily indebted poor countries (HIPC)High incomeHondurasHong Kong SAR, ChinaHungaryIBRD onlyIcelandIDA & IBRD totalIDA blendIDA onlyIDA totalIndiaIndonesiaIran, Islamic Rep.IraqIrelandIsraelItalyJamaicaJapanJordanKazakhstanKenyaKiribatiKorea, Dem. People’s Rep.Korea, Rep.KosovoKuwaitKyrgyz RepublicLao PDRLate-demographic dividendLatin America & Caribbean Latin America & Caribbean (excluding high income)Latin America & the Caribbean (IDA & IBRD countries)LatviaLeast developed countries: UN classificationLebanonLesothoLiberiaLibyaLithuaniaLow & middle incomeLow incomeLower middle incomeLuxembourgMacao SAR, ChinaMacedonia, FYRMadagascarMalawiMalaysiaMaldivesMaliMaltaMarshall IslandsMauritaniaMauritiusMexicoMicronesia, Fed. Sts.Middle East & North AfricaMiddle East & North Africa (excluding high income)Middle East & North Africa (IDA & IBRD countries)Middle incomeMoldovaMongoliaMontenegroMoroccoMozambiqueMyanmarNamibiaNauruNepalNetherlandsNew CaledoniaNew ZealandNicaraguaNigerNigeriaNorth AmericaNorthern Mariana IslandsNorwayOECD membersOmanOther small statesPacific island small statesPakistanPalauPanamaPapua New GuineaParaguayPeruPhilippinesPolandPortugalPost-demographic dividendPre-demographic dividendPuerto RicoQatarRomaniaRussian FederationRwandaSamoaSao Tome and PrincipeSaudi ArabiaSenegalSerbiaSeychellesSierra LeoneSingaporeSlovak RepublicSloveniaSmall statesSolomon IslandsSomaliaSouth AfricaSouth AsiaSouth Asia (IDA & IBRD)SpainSri LankaSt. Kitts and NevisSt. LuciaSt. Vincent and the GrenadinesSub-Saharan Africa Sub-Saharan Africa (excluding high income)Sub-Saharan Africa (IDA & IBRD countries)SudanSurinameSwazilandSwedenSwitzerlandSyrian Arab RepublicTajikistanTanzaniaThailandTimor-LesteTogoTongaTrinidad and TobagoTunisiaTurkeyTurkmenistanTurks and Caicos IslandsTuvaluUgandaUkraineUnited Arab EmiratesUnited KingdomUnited StatesUpper middle incomeUruguayUzbekistanVanuatuVenezuela, RBVietnamVirgin Islands (U.S.)WorldYemen, Rep.ZambiaZimbabwe Timeline:
This timeline shows a graph from 1971 to 2013 of British Virgin Islands. No data until 1970. Number of actual observations by date: 43.
Source name:
World Development Indicators
Source organization:
European Commission, Joint Research Centre (JRC)/Netherlands Environmental Assessment Agency (PBL). Emission Database for Global Atmospheric Research (EDGAR): http://edgar.jrc.ec.europa.eu/
Categories, topics:
Climate Change, Environment
Last updated:
apr 23, 2017
Indicators value changes by year
At the date of observation
Value
Absolute change
Change from previous value
jan 1, 1971
4.498
+4.498
0.0%
jan 1, 1972
3.954
-0.544
-12.09%
jan 1, 1973
4.279
+0.324
8.2%
jan 1, 1974
4.375
+0.096
2.25%
jan 1, 1975
4.52
+0.145
3.31%
jan 1, 1976
4.637
+0.118
2.6%
jan 1, 1977
4.709
+0.072
1.55%
jan 1, 1978
4.798
+0.089
1.89%
jan 1, 1979
4.89
+0.092
1.92%
jan 1, 1980
4.97
+0.08
1.64%
jan 1, 1981
5.144
+0.174
3.5%
jan 1, 1982
5.484
+0.34
6.61%
jan 1, 1983
5.778
+0.295
5.38%
jan 1, 1984
6.084
+0.306
5.29%
jan 1, 1985
6.212
+0.128
2.11%
jan 1, 1986
6.354
+0.142
2.28%
jan 1, 1987
6.534
+0.18
2.83%
jan 1, 1988
4.253
-2.281
-34.91%
jan 1, 1989
5.823
+1.57
36.91%
jan 1, 1990
5.83
+0.007
0.12%
jan 1, 1991
5.713
-0.117
-2.0%
jan 1, 1992
5.821
+0.108
1.88%
jan 1, 1993
5.981
+0.16
2.75%
jan 1, 1994
5.872
-0.109
-1.82%
jan 1, 1995
5.994
+0.121
2.07%
jan 1, 1996
5.998
+0.004
0.07%
jan 1, 1997
6.164
+0.166
2.76%
jan 1, 1998
6.137
-0.027
-0.44%
jan 1, 1999
6.78
+0.643
10.48%
jan 1, 2000
6.789
+0.01
0.14%
jan 1, 2001
6.562
-0.227
-3.35%
jan 1, 2002
6.514
-0.048
-0.73%
jan 1, 2003
6.511
-0.004
-0.06%
jan 1, 2004
6.663
+0.153
2.35%
jan 1, 2005
6.81
+0.147
2.2%
jan 1, 2006
6.765
-0.045
-0.66%
jan 1, 2007
6.855
+0.089
1.32%
jan 1, 2008
7.029
+0.175
2.55%
jan 1, 2009
7.173
+0.143
2.04%
jan 1, 2010
7.309
+0.137
1.91%
jan 1, 2011
7.446
+0.137
1.87%
jan 1, 2012
7.521
+0.074
1.0%
jan 1, 2013
7.595
+0.074
0.99%
Ranking of countries by current statistics by years


Comments: