29
/
en
AIzaSyAYiBZKx7MnpbEhh9jyipgxe19OcubqV5w
April 1, 2024
114007
Cote d'Ivoire
CIV
true
2
1
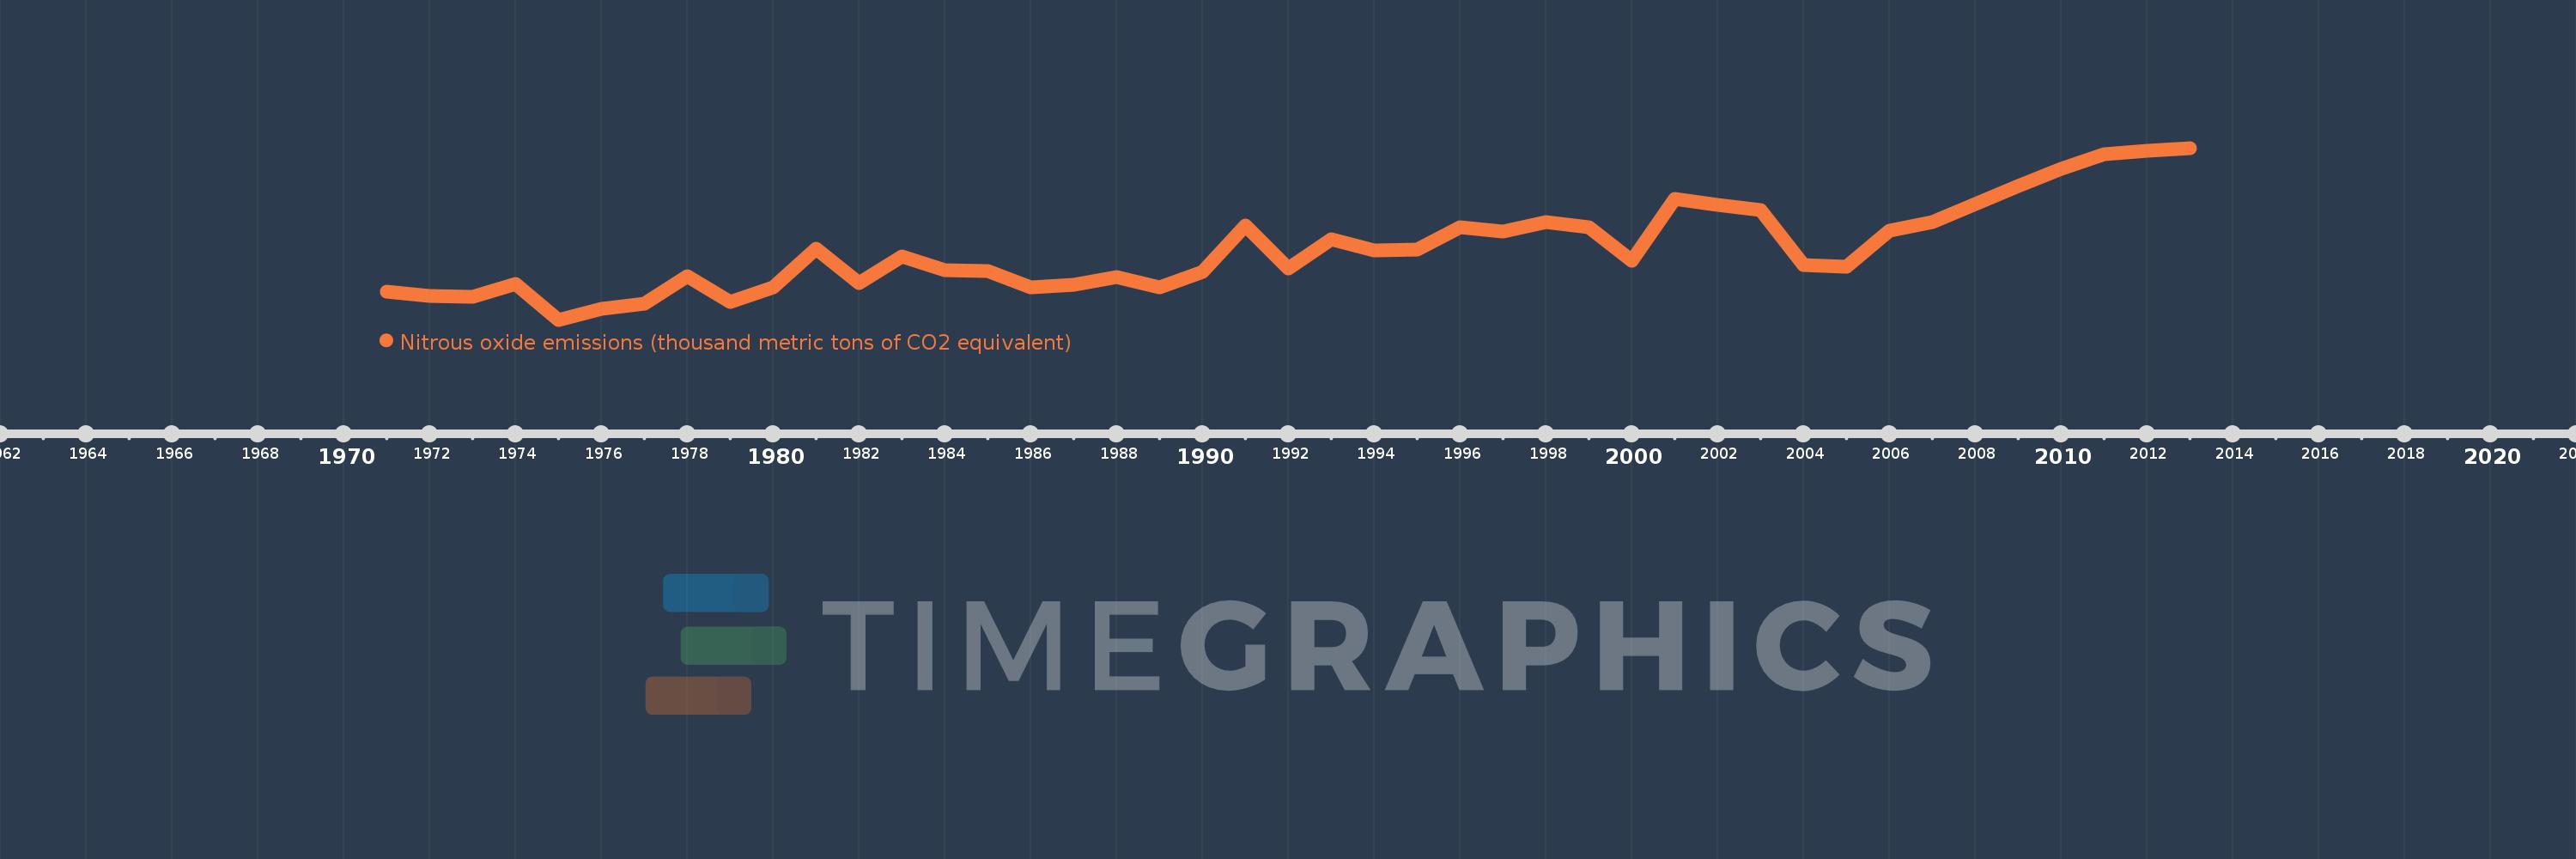
Nitrous oxide emissions (thousand metric tons of CO2 equivalent)
2013,2012,2011,2010,2009,2008,2007,2006,2005,2004,2003,2002,2001,2000,1999,1998,1997,1996,1995,1994,1993,1992,1991,1990,1989,1988,1987,1986,1985,1984,1983,1982,1981,1980,1979,1978,1977,1976,1975,1974,1973,1972,1971
This statistics in other country:
AfghanistanAlbaniaAlgeriaAmerican SamoaAndorraAngolaAntigua and BarbudaArab WorldArgentinaArmeniaArubaAustraliaAustriaAzerbaijanBahamas, TheBahrainBangladeshBarbadosBelarusBelgiumBelizeBeninBermudaBhutanBoliviaBosnia and HerzegovinaBotswanaBrazilBritish Virgin IslandsBrunei DarussalamBulgariaBurkina FasoBurundiCabo VerdeCambodiaCameroonCanadaCaribbean small statesCayman IslandsCentral African RepublicCentral Europe and the BalticsChadChileChinaColombiaComorosCongo, Dem. Rep.Congo, Rep.Costa RicaCote d'IvoireCroatiaCubaCyprusCzech RepublicDenmarkDjiboutiDominicaDominican RepublicEarly-demographic dividendEast Asia & PacificEast Asia & Pacific (excluding high income)East Asia & Pacific (IDA & IBRD countries)EcuadorEgypt, Arab Rep.El SalvadorEquatorial GuineaEritreaEstoniaEthiopiaEuro areaEurope & Central AsiaEurope & Central Asia (excluding high income)Europe & Central Asia (IDA & IBRD countries)European UnionFaroe IslandsFijiFinlandFragile and conflict affected situationsFranceFrench PolynesiaGabonGambia, TheGeorgiaGermanyGhanaGibraltarGreeceGreenlandGrenadaGuamGuatemalaGuineaGuinea-BissauGuyanaHaitiHeavily indebted poor countries (HIPC)High incomeHondurasHong Kong SAR, ChinaHungaryIBRD onlyIcelandIDA & IBRD totalIDA blendIDA onlyIDA totalIndiaIndonesiaIran, Islamic Rep.IraqIrelandIsraelItalyJamaicaJapanJordanKazakhstanKenyaKiribatiKorea, Dem. People’s Rep.Korea, Rep.KosovoKuwaitKyrgyz RepublicLao PDRLate-demographic dividendLatin America & Caribbean Latin America & Caribbean (excluding high income)Latin America & the Caribbean (IDA & IBRD countries)LatviaLeast developed countries: UN classificationLebanonLesothoLiberiaLibyaLithuaniaLow & middle incomeLow incomeLower middle incomeLuxembourgMacao SAR, ChinaMacedonia, FYRMadagascarMalawiMalaysiaMaldivesMaliMaltaMarshall IslandsMauritaniaMauritiusMexicoMicronesia, Fed. Sts.Middle East & North AfricaMiddle East & North Africa (excluding high income)Middle East & North Africa (IDA & IBRD countries)Middle incomeMoldovaMongoliaMontenegroMoroccoMozambiqueMyanmarNamibiaNauruNepalNetherlandsNew CaledoniaNew ZealandNicaraguaNigerNigeriaNorth AmericaNorthern Mariana IslandsNorwayOECD membersOmanOther small statesPacific island small statesPakistanPalauPanamaPapua New GuineaParaguayPeruPhilippinesPolandPortugalPost-demographic dividendPre-demographic dividendPuerto RicoQatarRomaniaRussian FederationRwandaSamoaSao Tome and PrincipeSaudi ArabiaSenegalSerbiaSeychellesSierra LeoneSingaporeSlovak RepublicSloveniaSmall statesSolomon IslandsSomaliaSouth AfricaSouth AsiaSouth Asia (IDA & IBRD)SpainSri LankaSt. Kitts and NevisSt. LuciaSt. Vincent and the GrenadinesSub-Saharan Africa Sub-Saharan Africa (excluding high income)Sub-Saharan Africa (IDA & IBRD countries)SudanSurinameSwazilandSwedenSwitzerlandSyrian Arab RepublicTajikistanTanzaniaThailandTimor-LesteTogoTongaTrinidad and TobagoTunisiaTurkeyTurkmenistanTurks and Caicos IslandsTuvaluUgandaUkraineUnited Arab EmiratesUnited KingdomUnited StatesUpper middle incomeUruguayUzbekistanVanuatuVenezuela, RBVietnamVirgin Islands (U.S.)WorldYemen, Rep.ZambiaZimbabwe Timeline:
This timeline shows a graph from 1971 to 2013 of Cote d'Ivoire. No data until 1970. Number of actual observations by date: 43.
Source name:
World Development Indicators
Source organization:
European Commission, Joint Research Centre (JRC)/Netherlands Environmental Assessment Agency (PBL). Emission Database for Global Atmospheric Research (EDGAR): http://edgar.jrc.ec.europa.eu/
Categories, topics:
Climate Change, Environment
Last updated:
apr 23, 2017
Indicators value changes by year
Minimum:
4.707K
jan 1, 1975
Maximum:
10.034K
jan 1, 2013
At the date of observation
Value
Absolute change
Change from previous value
jan 1, 1971
5.585K
+5.585K
0.0%
jan 1, 1972
5.455K
-130.882
-2.34%
jan 1, 1973
5.431K
-23.498
-0.43%
jan 1, 1974
5.826K
+395.281
7.28%
jan 1, 1975
4.707K
-1.119K
-19.21%
jan 1, 1976
5.035K
+327.825
6.96%
jan 1, 1977
5.202K
+166.78
3.31%
jan 1, 1978
6.057K
+854.856
16.43%
jan 1, 1979
5.272K
-784.827
-12.96%
jan 1, 1980
5.703K
+431.706
8.19%
jan 1, 1981
6.919K
+1.216K
21.32%
jan 1, 1982
5.856K
-1.063K
-15.37%
jan 1, 1983
6.679K
+822.926
14.05%
jan 1, 1984
6.247K
-431.396
-6.46%
jan 1, 1985
6.227K
-20.305
-0.33%
jan 1, 1986
5.713K
-513.856
-8.25%
jan 1, 1987
5.797K
+83.483
1.46%
jan 1, 1988
6.023K
+226.393
3.91%
jan 1, 1989
5.72K
-302.653
-5.02%
jan 1, 1990
6.193K
+472.75
8.26%
jan 1, 1991
7.618K
+1.425K
23.01%
jan 1, 1992
6.298K
-1.32K
-17.33%
jan 1, 1993
7.212K
+913.756
14.51%
jan 1, 1994
6.863K
-348.936
-4.84%
jan 1, 1995
6.885K
+22.599
0.33%
jan 1, 1996
7.577K
+691.61
10.04%
jan 1, 1997
7.451K
-126.139
-1.66%
jan 1, 1998
7.746K
+294.81
3.96%
jan 1, 1999
7.576K
-169.415
-2.19%
jan 1, 2000
6.549K
-1.027K
-13.55%
jan 1, 2001
8.456K
+1.906K
29.1%
jan 1, 2002
8.268K
-187.24
-2.21%
jan 1, 2003
8.098K
-170.779
-2.07%
jan 1, 2004
6.415K
-1.683K
-20.78%
jan 1, 2005
6.341K
-73.47
-1.15%
jan 1, 2006
7.478K
+1.136K
17.92%
jan 1, 2007
7.739K
+261.299
3.49%
jan 1, 2008
8.294K
+555.117
7.17%
jan 1, 2009
8.843K
+549.227
6.62%
jan 1, 2010
9.38K
+536.579
6.07%
jan 1, 2011
9.837K
+457.374
4.88%
jan 1, 2012
9.936K
+98.373
1.0%
jan 1, 2013
10.034K
+98.373
0.99%
Ranking of countries by current statistics by years


Comments: