29
/
en
AIzaSyAYiBZKx7MnpbEhh9jyipgxe19OcubqV5w
April 1, 2024
39311
IDA only
IDX
false
2
1
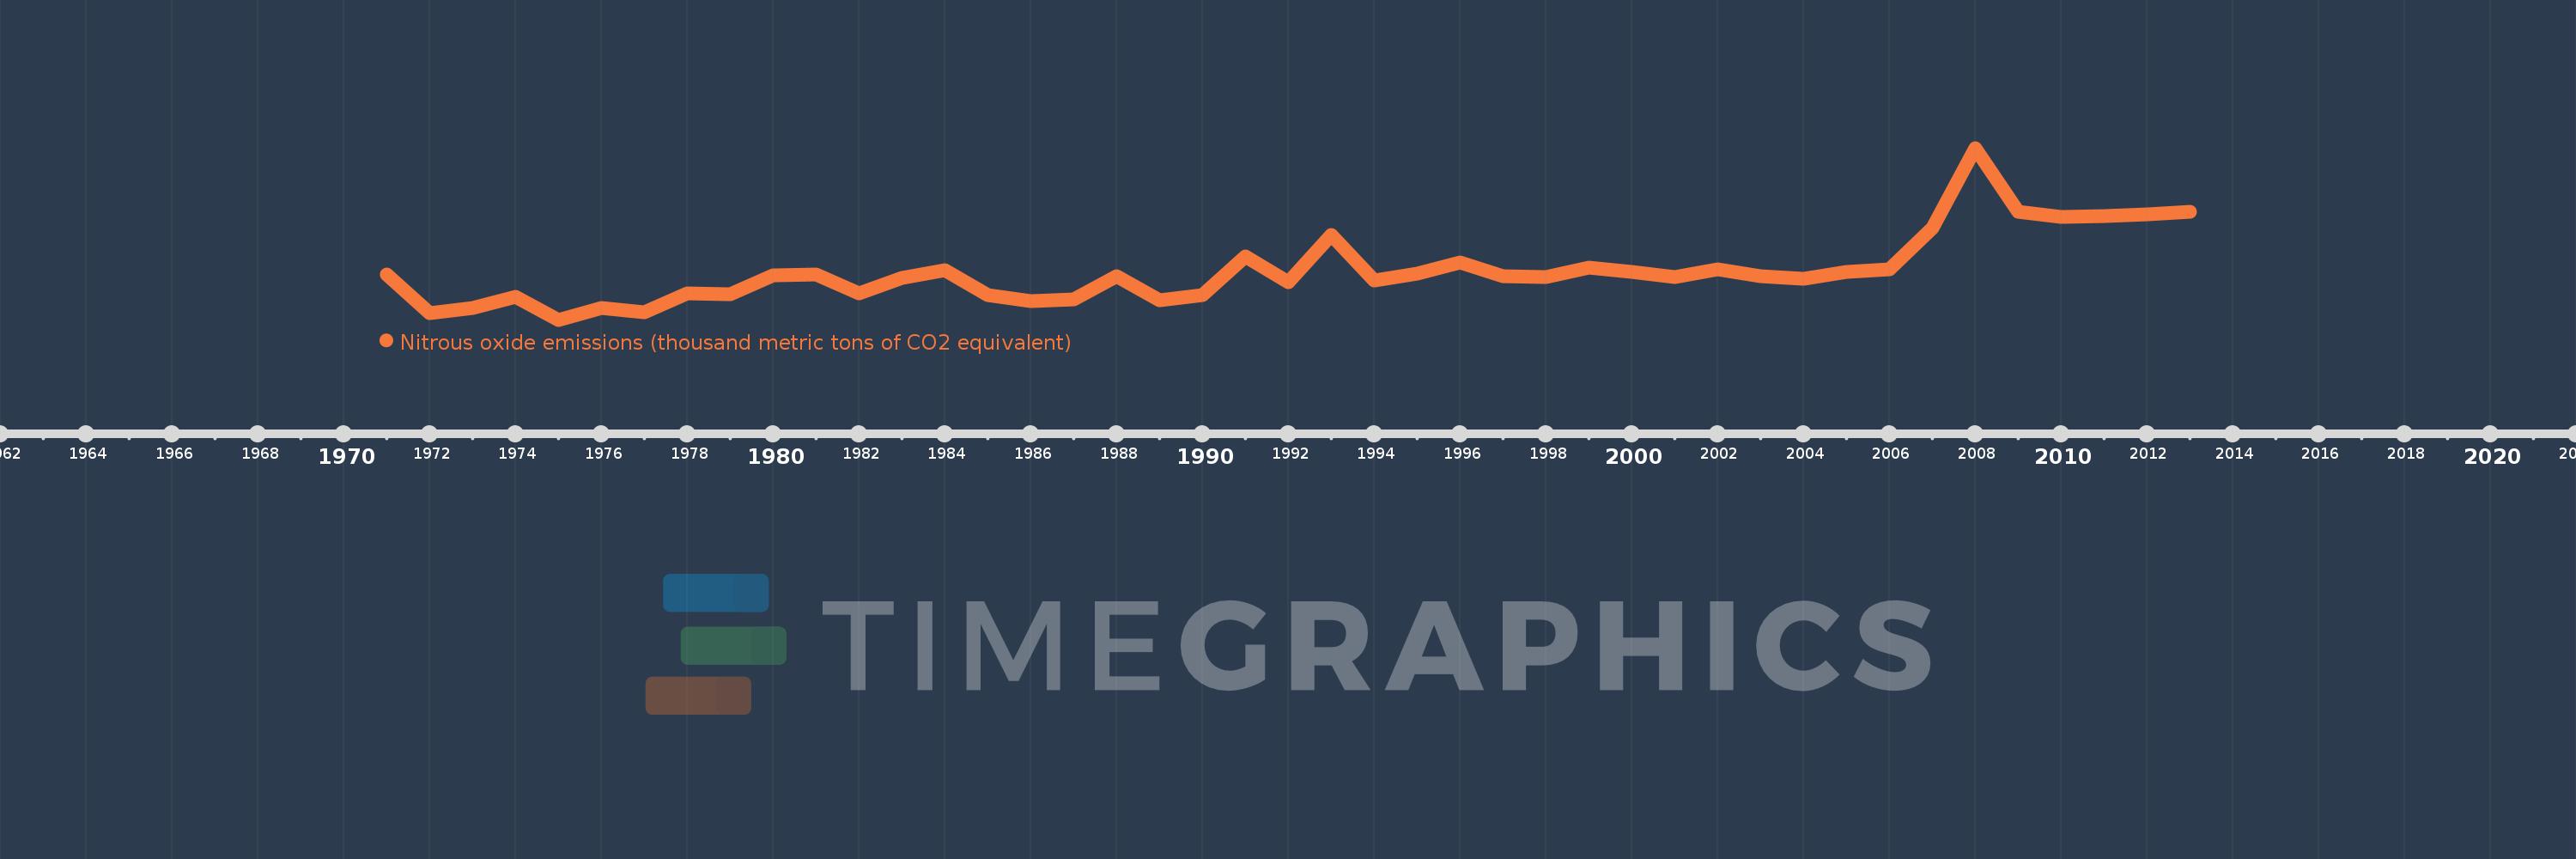
Nitrous oxide emissions (thousand metric tons of CO2 equivalent)
2013,2012,2011,2010,2009,2008,2007,2006,2005,2004,2003,2002,2001,2000,1999,1998,1997,1996,1995,1994,1993,1992,1991,1990,1989,1988,1987,1986,1985,1984,1983,1982,1981,1980,1979,1978,1977,1976,1975,1974,1973,1972,1971
This statistics in other country:
AfghanistanAlbaniaAlgeriaAmerican SamoaAndorraAngolaAntigua and BarbudaArab WorldArgentinaArmeniaArubaAustraliaAustriaAzerbaijanBahamas, TheBahrainBangladeshBarbadosBelarusBelgiumBelizeBeninBermudaBhutanBoliviaBosnia and HerzegovinaBotswanaBrazilBritish Virgin IslandsBrunei DarussalamBulgariaBurkina FasoBurundiCabo VerdeCambodiaCameroonCanadaCaribbean small statesCayman IslandsCentral African RepublicCentral Europe and the BalticsChadChileChinaColombiaComorosCongo, Dem. Rep.Congo, Rep.Costa RicaCote d'IvoireCroatiaCubaCyprusCzech RepublicDenmarkDjiboutiDominicaDominican RepublicEarly-demographic dividendEast Asia & PacificEast Asia & Pacific (excluding high income)East Asia & Pacific (IDA & IBRD countries)EcuadorEgypt, Arab Rep.El SalvadorEquatorial GuineaEritreaEstoniaEthiopiaEuro areaEurope & Central AsiaEurope & Central Asia (excluding high income)Europe & Central Asia (IDA & IBRD countries)European UnionFaroe IslandsFijiFinlandFragile and conflict affected situationsFranceFrench PolynesiaGabonGambia, TheGeorgiaGermanyGhanaGibraltarGreeceGreenlandGrenadaGuamGuatemalaGuineaGuinea-BissauGuyanaHaitiHeavily indebted poor countries (HIPC)High incomeHondurasHong Kong SAR, ChinaHungaryIBRD onlyIcelandIDA & IBRD totalIDA blendIDA onlyIDA totalIndiaIndonesiaIran, Islamic Rep.IraqIrelandIsraelItalyJamaicaJapanJordanKazakhstanKenyaKiribatiKorea, Dem. People’s Rep.Korea, Rep.KosovoKuwaitKyrgyz RepublicLao PDRLate-demographic dividendLatin America & Caribbean Latin America & Caribbean (excluding high income)Latin America & the Caribbean (IDA & IBRD countries)LatviaLeast developed countries: UN classificationLebanonLesothoLiberiaLibyaLithuaniaLow & middle incomeLow incomeLower middle incomeLuxembourgMacao SAR, ChinaMacedonia, FYRMadagascarMalawiMalaysiaMaldivesMaliMaltaMarshall IslandsMauritaniaMauritiusMexicoMicronesia, Fed. Sts.Middle East & North AfricaMiddle East & North Africa (excluding high income)Middle East & North Africa (IDA & IBRD countries)Middle incomeMoldovaMongoliaMontenegroMoroccoMozambiqueMyanmarNamibiaNauruNepalNetherlandsNew CaledoniaNew ZealandNicaraguaNigerNigeriaNorth AmericaNorthern Mariana IslandsNorwayOECD membersOmanOther small statesPacific island small statesPakistanPalauPanamaPapua New GuineaParaguayPeruPhilippinesPolandPortugalPost-demographic dividendPre-demographic dividendPuerto RicoQatarRomaniaRussian FederationRwandaSamoaSao Tome and PrincipeSaudi ArabiaSenegalSerbiaSeychellesSierra LeoneSingaporeSlovak RepublicSloveniaSmall statesSolomon IslandsSomaliaSouth AfricaSouth AsiaSouth Asia (IDA & IBRD)SpainSri LankaSt. Kitts and NevisSt. LuciaSt. Vincent and the GrenadinesSub-Saharan Africa Sub-Saharan Africa (excluding high income)Sub-Saharan Africa (IDA & IBRD countries)SudanSurinameSwazilandSwedenSwitzerlandSyrian Arab RepublicTajikistanTanzaniaThailandTimor-LesteTogoTongaTrinidad and TobagoTunisiaTurkeyTurkmenistanTurks and Caicos IslandsTuvaluUgandaUkraineUnited Arab EmiratesUnited KingdomUnited StatesUpper middle incomeUruguayUzbekistanVanuatuVenezuela, RBVietnamVirgin Islands (U.S.)WorldYemen, Rep.ZambiaZimbabwe Timeline:
This timeline shows a graph from 1971 to 2013 of IDA only. No data until 1970. Number of actual observations by date: 43.
Source name:
World Development Indicators
Source organization:
European Commission, Joint Research Centre (JRC)/Netherlands Environmental Assessment Agency (PBL). Emission Database for Global Atmospheric Research (EDGAR): http://edgar.jrc.ec.europa.eu/
Categories, topics:
Climate Change, Environment
Last updated:
apr 23, 2017
Indicators value changes by year
Minimum:
267.774K
jan 1, 1975
Maximum:
770.405K
jan 1, 2008
At the date of observation
Value
Absolute change
Change from previous value
jan 1, 1971
398.974K
+398.974K
0.0%
jan 1, 1972
288.243K
-110.731K
-27.75%
jan 1, 1973
303.312K
+15.069K
5.23%
jan 1, 1974
335.807K
+32.496K
10.71%
jan 1, 1975
267.774K
-68.033K
-20.26%
jan 1, 1976
301.419K
+33.645K
12.56%
jan 1, 1977
290.182K
-11.238K
-3.73%
jan 1, 1978
344.539K
+54.357K
18.73%
jan 1, 1979
342.462K
-2.077K
-0.6%
jan 1, 1980
397.295K
+54.833K
16.01%
jan 1, 1981
400.283K
+2.988K
0.75%
jan 1, 1982
346.014K
-54.269K
-13.56%
jan 1, 1983
388.939K
+42.925K
12.41%
jan 1, 1984
413.145K
+24.206K
6.22%
jan 1, 1985
339.393K
-73.752K
-17.85%
jan 1, 1986
322.57K
-16.823K
-4.96%
jan 1, 1987
326.347K
+3.777K
1.17%
jan 1, 1988
395.014K
+68.666K
21.04%
jan 1, 1989
324.826K
-70.188K
-17.77%
jan 1, 1990
339.806K
+14.98K
4.61%
jan 1, 1991
451.972K
+112.166K
33.01%
jan 1, 1992
377.257K
-74.715K
-16.53%
jan 1, 1993
516.698K
+139.441K
36.96%
jan 1, 1994
383.618K
-133.079K
-25.76%
jan 1, 1995
403.38K
+19.762K
5.15%
jan 1, 1996
434.57K
+31.189K
7.73%
jan 1, 1997
396.416K
-38.154K
-8.78%
jan 1, 1998
393.71K
-2.706K
-0.68%
jan 1, 1999
419.284K
+25.574K
6.5%
jan 1, 2000
407.027K
-12.257K
-2.92%
jan 1, 2001
391.517K
-15.51K
-3.81%
jan 1, 2002
415.297K
+23.78K
6.07%
jan 1, 2003
393.939K
-21.358K
-5.14%
jan 1, 2004
387.227K
-6.712K
-1.7%
jan 1, 2005
406.678K
+19.451K
5.02%
jan 1, 2006
415.7K
+9.022K
2.22%
jan 1, 2007
537.159K
+121.46K
29.22%
jan 1, 2008
770.405K
+233.245K
43.42%
jan 1, 2009
583.462K
-186.943K
-24.27%
jan 1, 2010
568.772K
-14.69K
-2.52%
jan 1, 2011
571.414K
+2.642K
0.46%
jan 1, 2012
577.213K
+5.799K
1.01%
jan 1, 2013
583.011K
+5.799K
1.0%
Ranking of countries by current statistics by years


Comments: