29
/
en
AIzaSyAYiBZKx7MnpbEhh9jyipgxe19OcubqV5w
April 1, 2024
263836
Timor-Leste
TLS
true
2
1
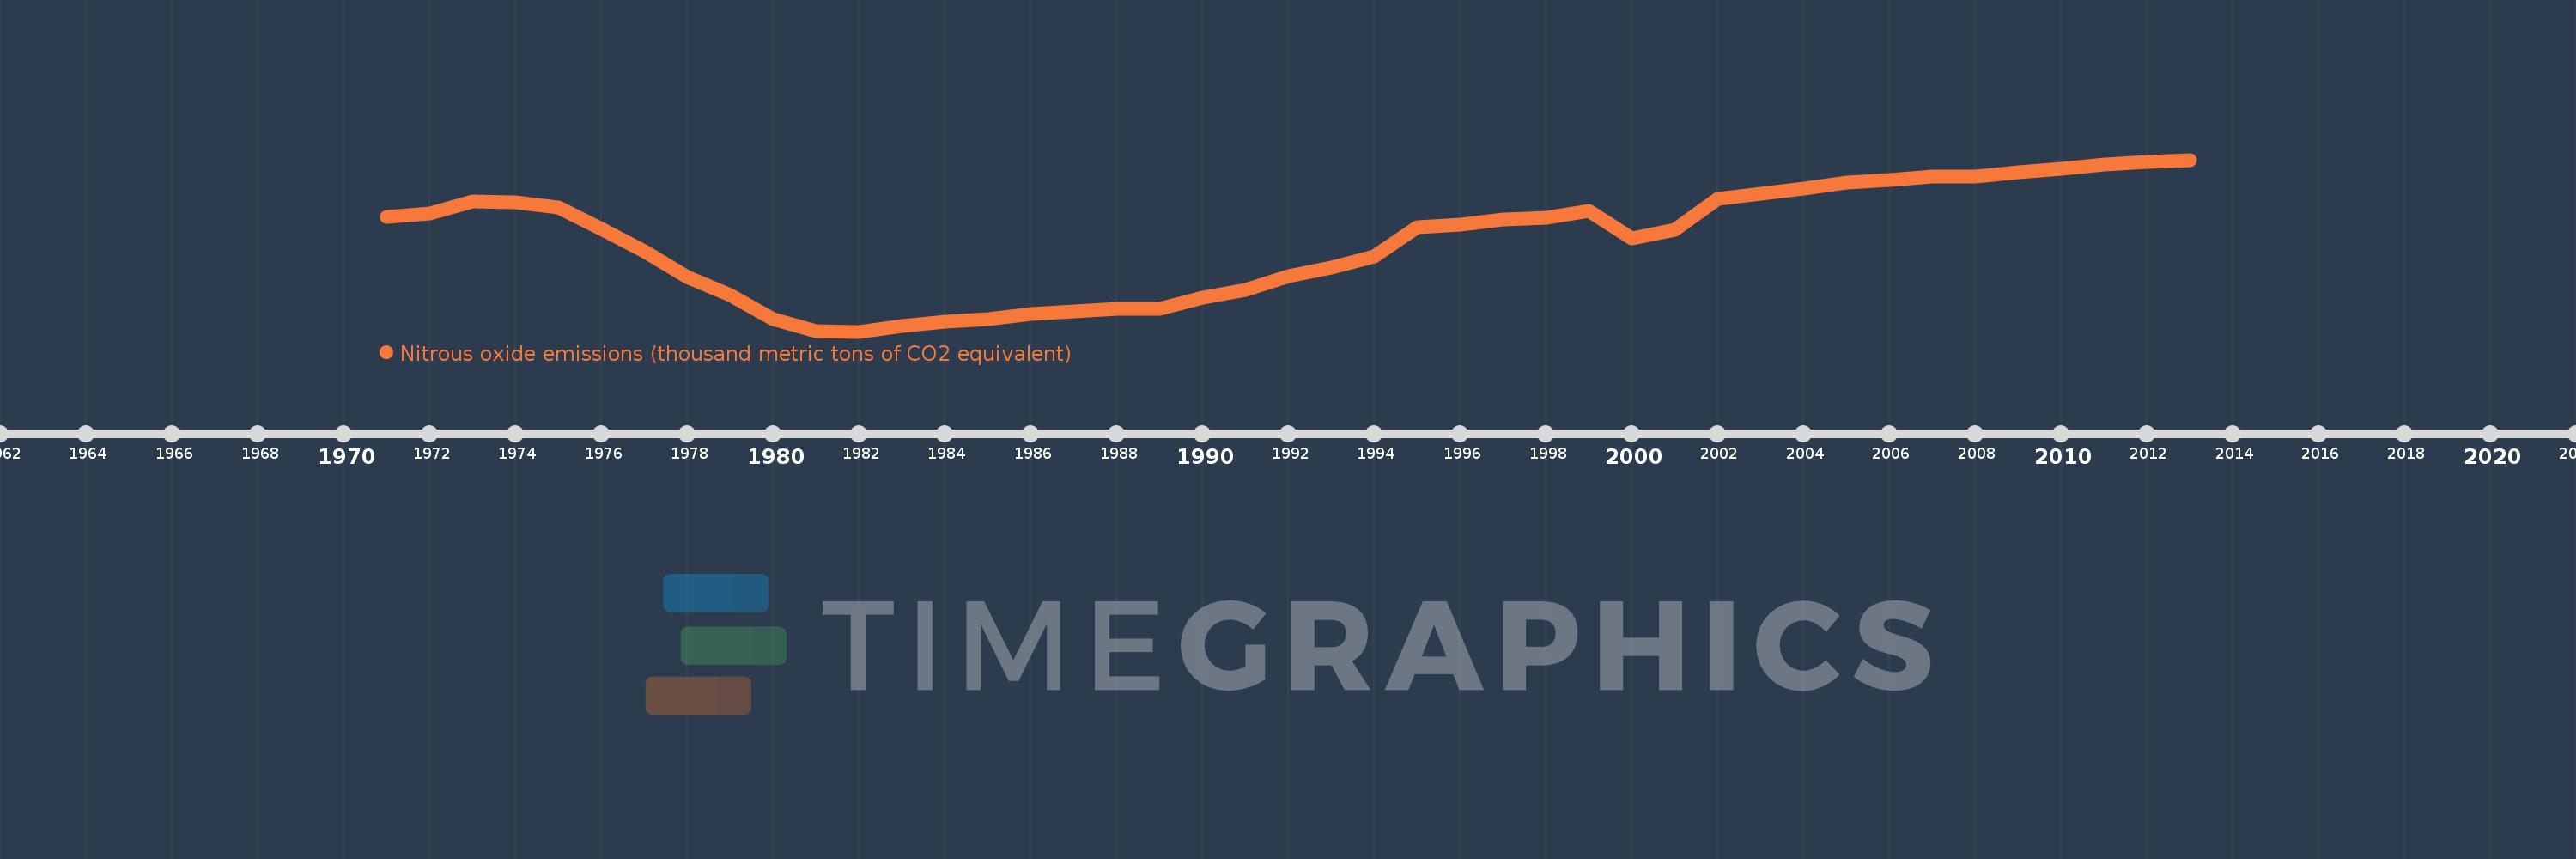
Nitrous oxide emissions (thousand metric tons of CO2 equivalent)
2013,2012,2011,2010,2009,2008,2007,2006,2005,2004,2003,2002,2001,2000,1999,1998,1997,1996,1995,1994,1993,1992,1991,1990,1989,1988,1987,1986,1985,1984,1983,1982,1981,1980,1979,1978,1977,1976,1975,1974,1973,1972,1971
This statistics in other country:
AfghanistanAlbaniaAlgeriaAmerican SamoaAndorraAngolaAntigua and BarbudaArab WorldArgentinaArmeniaArubaAustraliaAustriaAzerbaijanBahamas, TheBahrainBangladeshBarbadosBelarusBelgiumBelizeBeninBermudaBhutanBoliviaBosnia and HerzegovinaBotswanaBrazilBritish Virgin IslandsBrunei DarussalamBulgariaBurkina FasoBurundiCabo VerdeCambodiaCameroonCanadaCaribbean small statesCayman IslandsCentral African RepublicCentral Europe and the BalticsChadChileChinaColombiaComorosCongo, Dem. Rep.Congo, Rep.Costa RicaCote d'IvoireCroatiaCubaCyprusCzech RepublicDenmarkDjiboutiDominicaDominican RepublicEarly-demographic dividendEast Asia & PacificEast Asia & Pacific (excluding high income)East Asia & Pacific (IDA & IBRD countries)EcuadorEgypt, Arab Rep.El SalvadorEquatorial GuineaEritreaEstoniaEthiopiaEuro areaEurope & Central AsiaEurope & Central Asia (excluding high income)Europe & Central Asia (IDA & IBRD countries)European UnionFaroe IslandsFijiFinlandFragile and conflict affected situationsFranceFrench PolynesiaGabonGambia, TheGeorgiaGermanyGhanaGibraltarGreeceGreenlandGrenadaGuamGuatemalaGuineaGuinea-BissauGuyanaHaitiHeavily indebted poor countries (HIPC)High incomeHondurasHong Kong SAR, ChinaHungaryIBRD onlyIcelandIDA & IBRD totalIDA blendIDA onlyIDA totalIndiaIndonesiaIran, Islamic Rep.IraqIrelandIsraelItalyJamaicaJapanJordanKazakhstanKenyaKiribatiKorea, Dem. People’s Rep.Korea, Rep.KosovoKuwaitKyrgyz RepublicLao PDRLate-demographic dividendLatin America & Caribbean Latin America & Caribbean (excluding high income)Latin America & the Caribbean (IDA & IBRD countries)LatviaLeast developed countries: UN classificationLebanonLesothoLiberiaLibyaLithuaniaLow & middle incomeLow incomeLower middle incomeLuxembourgMacao SAR, ChinaMacedonia, FYRMadagascarMalawiMalaysiaMaldivesMaliMaltaMarshall IslandsMauritaniaMauritiusMexicoMicronesia, Fed. Sts.Middle East & North AfricaMiddle East & North Africa (excluding high income)Middle East & North Africa (IDA & IBRD countries)Middle incomeMoldovaMongoliaMontenegroMoroccoMozambiqueMyanmarNamibiaNauruNepalNetherlandsNew CaledoniaNew ZealandNicaraguaNigerNigeriaNorth AmericaNorthern Mariana IslandsNorwayOECD membersOmanOther small statesPacific island small statesPakistanPalauPanamaPapua New GuineaParaguayPeruPhilippinesPolandPortugalPost-demographic dividendPre-demographic dividendPuerto RicoQatarRomaniaRussian FederationRwandaSamoaSao Tome and PrincipeSaudi ArabiaSenegalSerbiaSeychellesSierra LeoneSingaporeSlovak RepublicSloveniaSmall statesSolomon IslandsSomaliaSouth AfricaSouth AsiaSouth Asia (IDA & IBRD)SpainSri LankaSt. Kitts and NevisSt. LuciaSt. Vincent and the GrenadinesSub-Saharan Africa Sub-Saharan Africa (excluding high income)Sub-Saharan Africa (IDA & IBRD countries)SudanSurinameSwazilandSwedenSwitzerlandSyrian Arab RepublicTajikistanTanzaniaThailandTimor-LesteTogoTongaTrinidad and TobagoTunisiaTurkeyTurkmenistanTurks and Caicos IslandsTuvaluUgandaUkraineUnited Arab EmiratesUnited KingdomUnited StatesUpper middle incomeUruguayUzbekistanVanuatuVenezuela, RBVietnamVirgin Islands (U.S.)WorldYemen, Rep.ZambiaZimbabwe Timeline:
This timeline shows a graph from 1971 to 2013 of Timor-Leste. No data until 1970. Number of actual observations by date: 43.
Source name:
World Development Indicators
Source organization:
European Commission, Joint Research Centre (JRC)/Netherlands Environmental Assessment Agency (PBL). Emission Database for Global Atmospheric Research (EDGAR): http://edgar.jrc.ec.europa.eu/
Categories, topics:
Climate Change, Environment
Last updated:
apr 23, 2017
Indicators value changes by year
Minimum:
74.864
jan 1, 1982
Maximum:
225.541
jan 1, 2013
At the date of observation
Value
Absolute change
Change from previous value
jan 1, 1971
175.375
+175.375
0.0%
jan 1, 1972
178.08
+2.705
1.54%
jan 1, 1973
189.097
+11.017
6.19%
jan 1, 1974
188.101
-0.996
-0.53%
jan 1, 1975
183.558
-4.543
-2.42%
jan 1, 1976
164.847
-18.711
-10.19%
jan 1, 1977
144.948
-19.899
-12.07%
jan 1, 1978
122.499
-22.449
-15.49%
jan 1, 1979
106.933
-15.566
-12.71%
jan 1, 1980
86.058
-20.874
-19.52%
jan 1, 1981
75.458
-10.601
-12.32%
jan 1, 1982
74.864
-0.593
-0.79%
jan 1, 1983
79.909
+5.044
6.74%
jan 1, 1984
83.572
+3.663
4.58%
jan 1, 1985
85.514
+1.942
2.32%
jan 1, 1986
89.941
+4.426
5.18%
jan 1, 1987
92.765
+2.825
3.14%
jan 1, 1988
95.131
+2.365
2.55%
jan 1, 1989
94.846
-0.285
-0.3%
jan 1, 1990
104.484
+9.639
10.16%
jan 1, 1991
111.54
+7.056
6.75%
jan 1, 1992
123.668
+12.128
10.87%
jan 1, 1993
131.298
+7.63
6.17%
jan 1, 1994
141.091
+9.793
7.46%
jan 1, 1995
166.505
+25.414
18.01%
jan 1, 1996
168.554
+2.048
1.23%
jan 1, 1997
172.819
+4.266
2.53%
jan 1, 1998
175.001
+2.181
1.26%
jan 1, 1999
180.742
+5.742
3.28%
jan 1, 2000
156.919
-23.823
-13.18%
jan 1, 2001
164.349
+7.43
4.73%
jan 1, 2002
191.547
+27.198
16.55%
jan 1, 2003
196.131
+4.585
2.39%
jan 1, 2004
200.548
+4.417
2.25%
jan 1, 2005
205.215
+4.666
2.33%
jan 1, 2006
207.57
+2.355
1.15%
jan 1, 2007
210.991
+3.421
1.65%
jan 1, 2008
211.189
+0.198
0.09%
jan 1, 2009
214.266
+3.077
1.46%
jan 1, 2010
217.337
+3.071
1.43%
jan 1, 2011
221.119
+3.782
1.74%
jan 1, 2012
223.33
+2.211
1.0%
jan 1, 2013
225.541
+2.211
0.99%
Ranking of countries by current statistics by years


Comments: