29
/
en
AIzaSyAYiBZKx7MnpbEhh9jyipgxe19OcubqV5w
April 1, 2024
84099
Benin
BEN
true
2
1
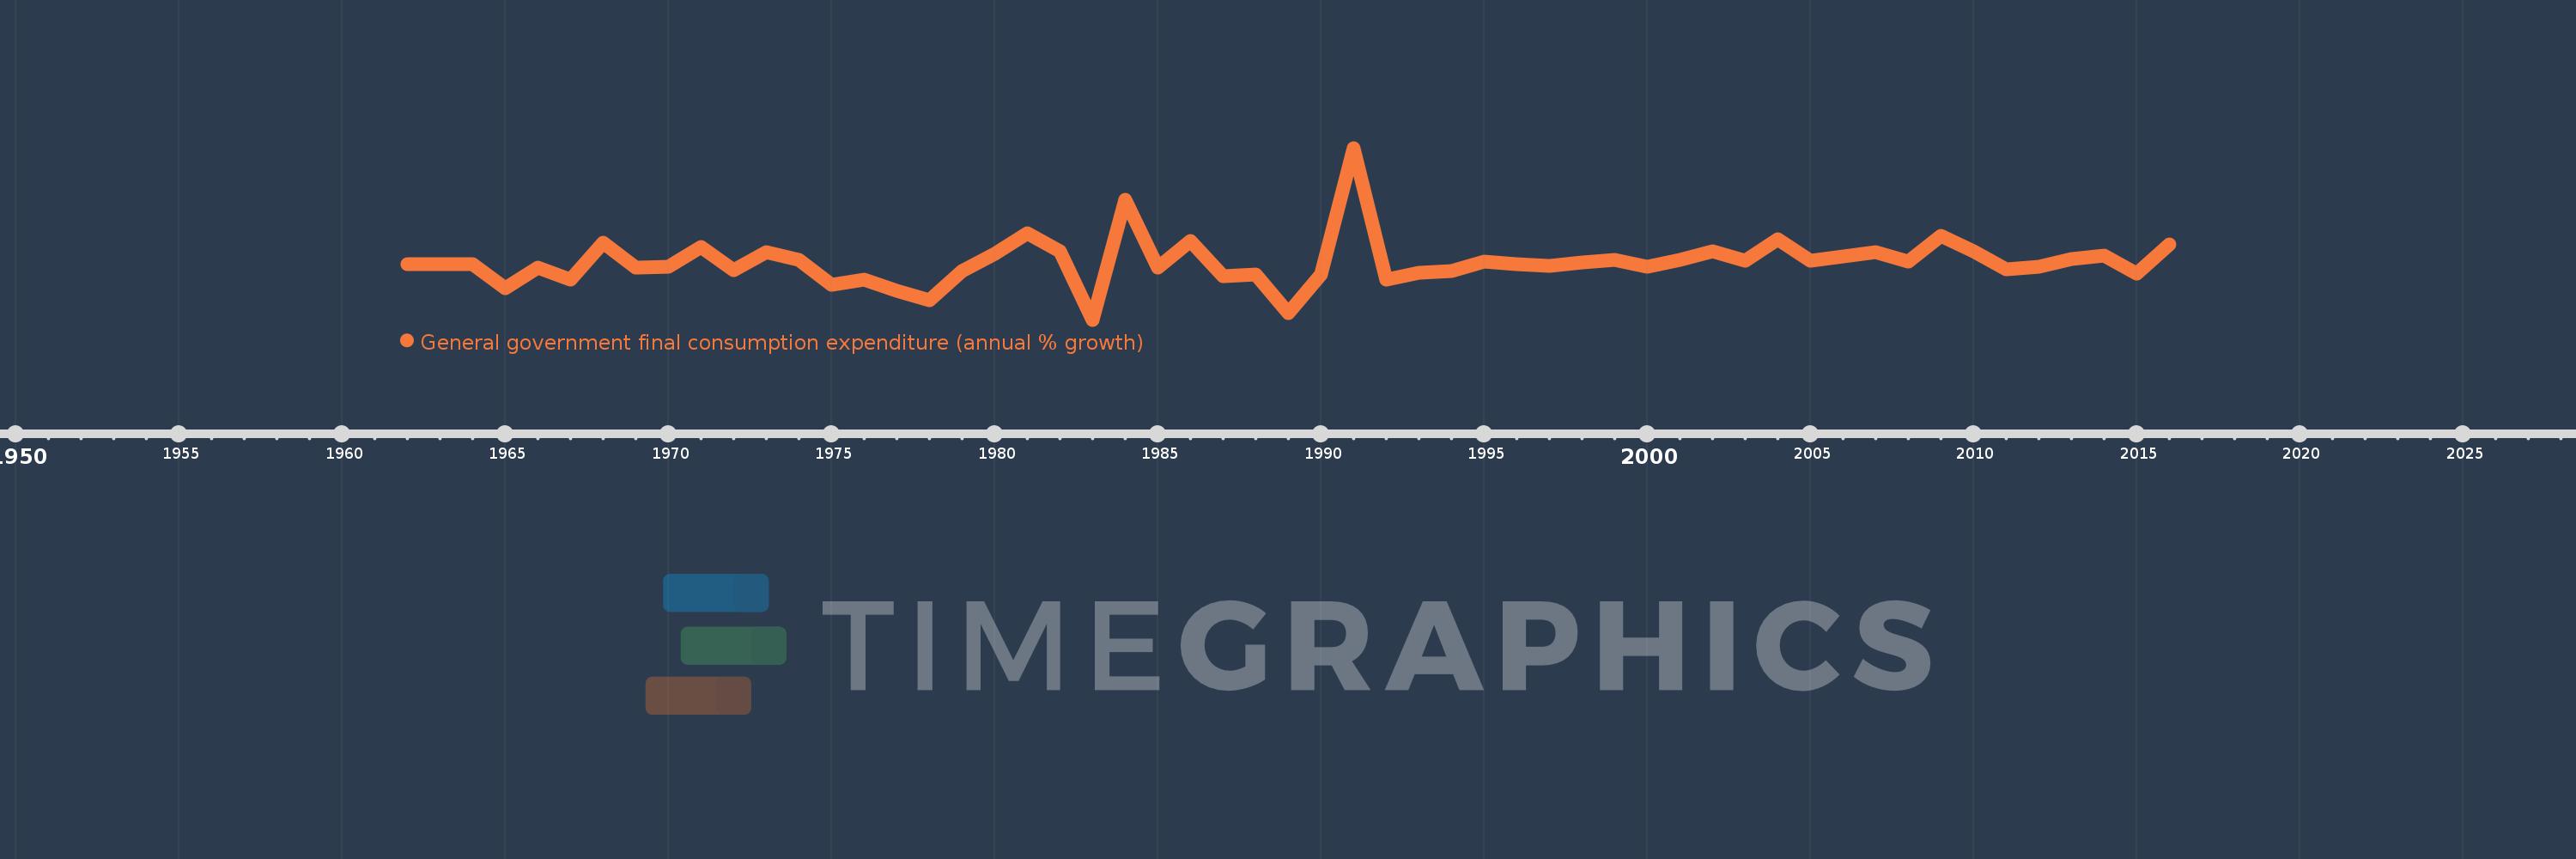
General government final consumption expenditure (annual % growth)
2016,2015,2014,2013,2012,2011,2010,2009,2008,2007,2006,2005,2004,2003,2002,2001,2000,1999,1998,1997,1996,1995,1994,1993,1992,1991,1990,1989,1988,1987,1986,1985,1984,1983,1982,1981,1980,1979,1978,1977,1976,1975,1974,1973,1972,1971,1970,1969,1968,1967,1966,1965,1964,1963,1962
This statistics in other country:
AlbaniaAlgeriaAntigua and BarbudaArab WorldArgentinaArmeniaAustraliaAustriaAzerbaijanBahamas, TheBahrainBangladeshBarbadosBelarusBelgiumBelizeBeninBhutanBoliviaBosnia and HerzegovinaBotswanaBrazilBrunei DarussalamBulgariaBurkina FasoBurundiCabo VerdeCambodiaCameroonCanadaCaribbean small statesCentral Europe and the BalticsChadChileChinaColombiaComorosCongo, Dem. Rep.Congo, Rep.Costa RicaCote d'IvoireCroatiaCubaCyprusCzech RepublicDenmarkDjiboutiDominican RepublicEarly-demographic dividendEast Asia & PacificEast Asia & Pacific (excluding high income)East Asia & Pacific (IDA & IBRD countries)EcuadorEgypt, Arab Rep.El SalvadorEquatorial GuineaEritreaEstoniaEthiopiaEuro areaEurope & Central AsiaEurope & Central Asia (excluding high income)Europe & Central Asia (IDA & IBRD countries)European UnionFijiFinlandFranceGabonGambia, TheGeorgiaGermanyGhanaGreeceGuatemalaGuineaGuinea-BissauHaitiHeavily indebted poor countries (HIPC)High incomeHondurasHong Kong SAR, ChinaHungaryIBRD onlyIcelandIDA & IBRD totalIDA blendIDA onlyIDA totalIndiaIndonesiaIran, Islamic Rep.IrelandIsraelItalyJamaicaJapanJordanKazakhstanKenyaKorea, Rep.KosovoKuwaitKyrgyz RepublicLao PDRLate-demographic dividendLatin America & Caribbean Latin America & Caribbean (excluding high income)Latin America & the Caribbean (IDA & IBRD countries)LatviaLebanonLiberiaLithuaniaLow & middle incomeLow incomeLower middle incomeLuxembourgMacao SAR, ChinaMacedonia, FYRMadagascarMalawiMalaysiaMaliMaltaMauritaniaMauritiusMexicoMiddle East & North AfricaMiddle East & North Africa (excluding high income)Middle East & North Africa (IDA & IBRD countries)Middle incomeMoldovaMongoliaMontenegroMoroccoMozambiqueNamibiaNepalNetherlandsNew ZealandNicaraguaNigerNigeriaNorth AmericaNorwayOECD membersOmanOther small statesPakistanPanamaPapua New GuineaParaguayPeruPhilippinesPolandPortugalPost-demographic dividendPuerto RicoQatarRomaniaRussian FederationRwandaSaudi ArabiaSenegalSerbiaSeychellesSierra LeoneSingaporeSlovak RepublicSloveniaSmall statesSomaliaSouth AfricaSouth AsiaSouth Asia (IDA & IBRD)South SudanSpainSri LankaSub-Saharan Africa Sub-Saharan Africa (excluding high income)Sub-Saharan Africa (IDA & IBRD countries)SudanSurinameSwazilandSwedenSwitzerlandSyrian Arab RepublicTajikistanTanzaniaThailandTimor-LesteTogoTrinidad and TobagoTunisiaTurkeyTurkmenistanUgandaUkraineUnited Arab EmiratesUnited KingdomUnited StatesUpper middle incomeUruguayVanuatuVenezuela, RBVietnamWest Bank and GazaWorldZimbabwe Timeline:
This timeline shows a graph from 1962 to 2016 of Benin. No data until 1961. Number of actual observations by date: 55.
Source name:
World Development Indicators
Source organization:
World Bank national accounts data, and OECD National Accounts data files.
Categories, topics:
Economy & Growth
Last updated:
apr 23, 2017
Indicators value changes by year
Minimum:
-22.733
jan 1, 1983
Maximum:
57.365
jan 1, 1991
At the date of observation
Value
Absolute change
Change from previous value
jan 1, 1962
3.252
+3.252
0.0%
jan 1, 1963
3.15
-0.103
-3.16%
jan 1, 1964
3.053
-0.096
-3.05%
jan 1, 1965
-8.148
-11.201
-366.86%
jan 1, 1966
1.617
+9.765
-119.85%
jan 1, 1967
-3.968
-5.585
-345.34%
jan 1, 1968
13.223
+17.191
-433.24%
jan 1, 1969
1.46
-11.763
-88.96%
jan 1, 1970
2.158
+0.699
47.85%
jan 1, 1971
11.265
+9.106
421.93%
jan 1, 1972
0.466
-10.798
-95.86%
jan 1, 1973
8.88
+8.413
1.8K%
jan 1, 1974
5.337
-3.542
-39.89%
jan 1, 1975
-6.364
-11.701
-219.24%
jan 1, 1976
-3.896
+2.468
-38.78%
jan 1, 1977
-9.144
-5.248
134.7%
jan 1, 1978
-13.535
-4.391
48.02%
jan 1, 1979
-0.058
+13.477
-99.58%
jan 1, 1980
7.918
+7.975
-13.87K%
jan 1, 1981
17.491
+9.573
120.91%
jan 1, 1982
9.095
-8.396
-48.0%
jan 1, 1983
-22.733
-31.828
-349.96%
jan 1, 1984
33.333
+56.067
-246.63%
jan 1, 1985
1.603
-31.731
-95.19%
jan 1, 1986
13.88
+12.278
766.13%
jan 1, 1987
-2.355
-16.235
-116.96%
jan 1, 1988
-1.56
+0.794
-33.73%
jan 1, 1989
-19.597
-18.036
1.16K%
jan 1, 1990
-1.733
+17.864
-91.16%
jan 1, 1991
57.365
+59.097
-3.41K%
jan 1, 1992
-4.106
-61.471
-107.16%
jan 1, 1993
-0.627
+3.479
-84.72%
jan 1, 1994
0.018
+0.645
-102.83%
jan 1, 1995
4.3
+4.282
24.09K%
jan 1, 1996
3.065
-1.236
-28.73%
jan 1, 1997
2.272
-0.792
-25.85%
jan 1, 1998
3.981
+1.708
75.18%
jan 1, 1999
5.188
+1.208
30.34%
jan 1, 2000
2.17
-3.018
-58.17%
jan 1, 2001
5.189
+3.018
139.06%
jan 1, 2002
9.254
+4.065
78.35%
jan 1, 2003
4.59
-4.664
-50.4%
jan 1, 2004
14.806
+10.216
222.59%
jan 1, 2005
4.817
-9.989
-67.47%
jan 1, 2006
6.7
+1.884
39.11%
jan 1, 2007
8.864
+2.163
32.29%
jan 1, 2008
4.186
-4.678
-52.78%
jan 1, 2009
16.316
+12.13
289.78%
jan 1, 2010
9.267
-7.048
-43.2%
jan 1, 2011
0.906
-8.361
-90.22%
jan 1, 2012
1.929
+1.023
112.96%
jan 1, 2013
5.622
+3.693
191.41%
jan 1, 2014
7.292
+1.67
29.71%
jan 1, 2015
-1.091
-8.384
-114.97%
jan 1, 2016
12.389
+13.481
-1.24K%
Ranking of countries by current statistics by years


Comments: