29
/
en
AIzaSyAYiBZKx7MnpbEhh9jyipgxe19OcubqV5w
April 1, 2024
164851
Jordan
JOR
true
2
1
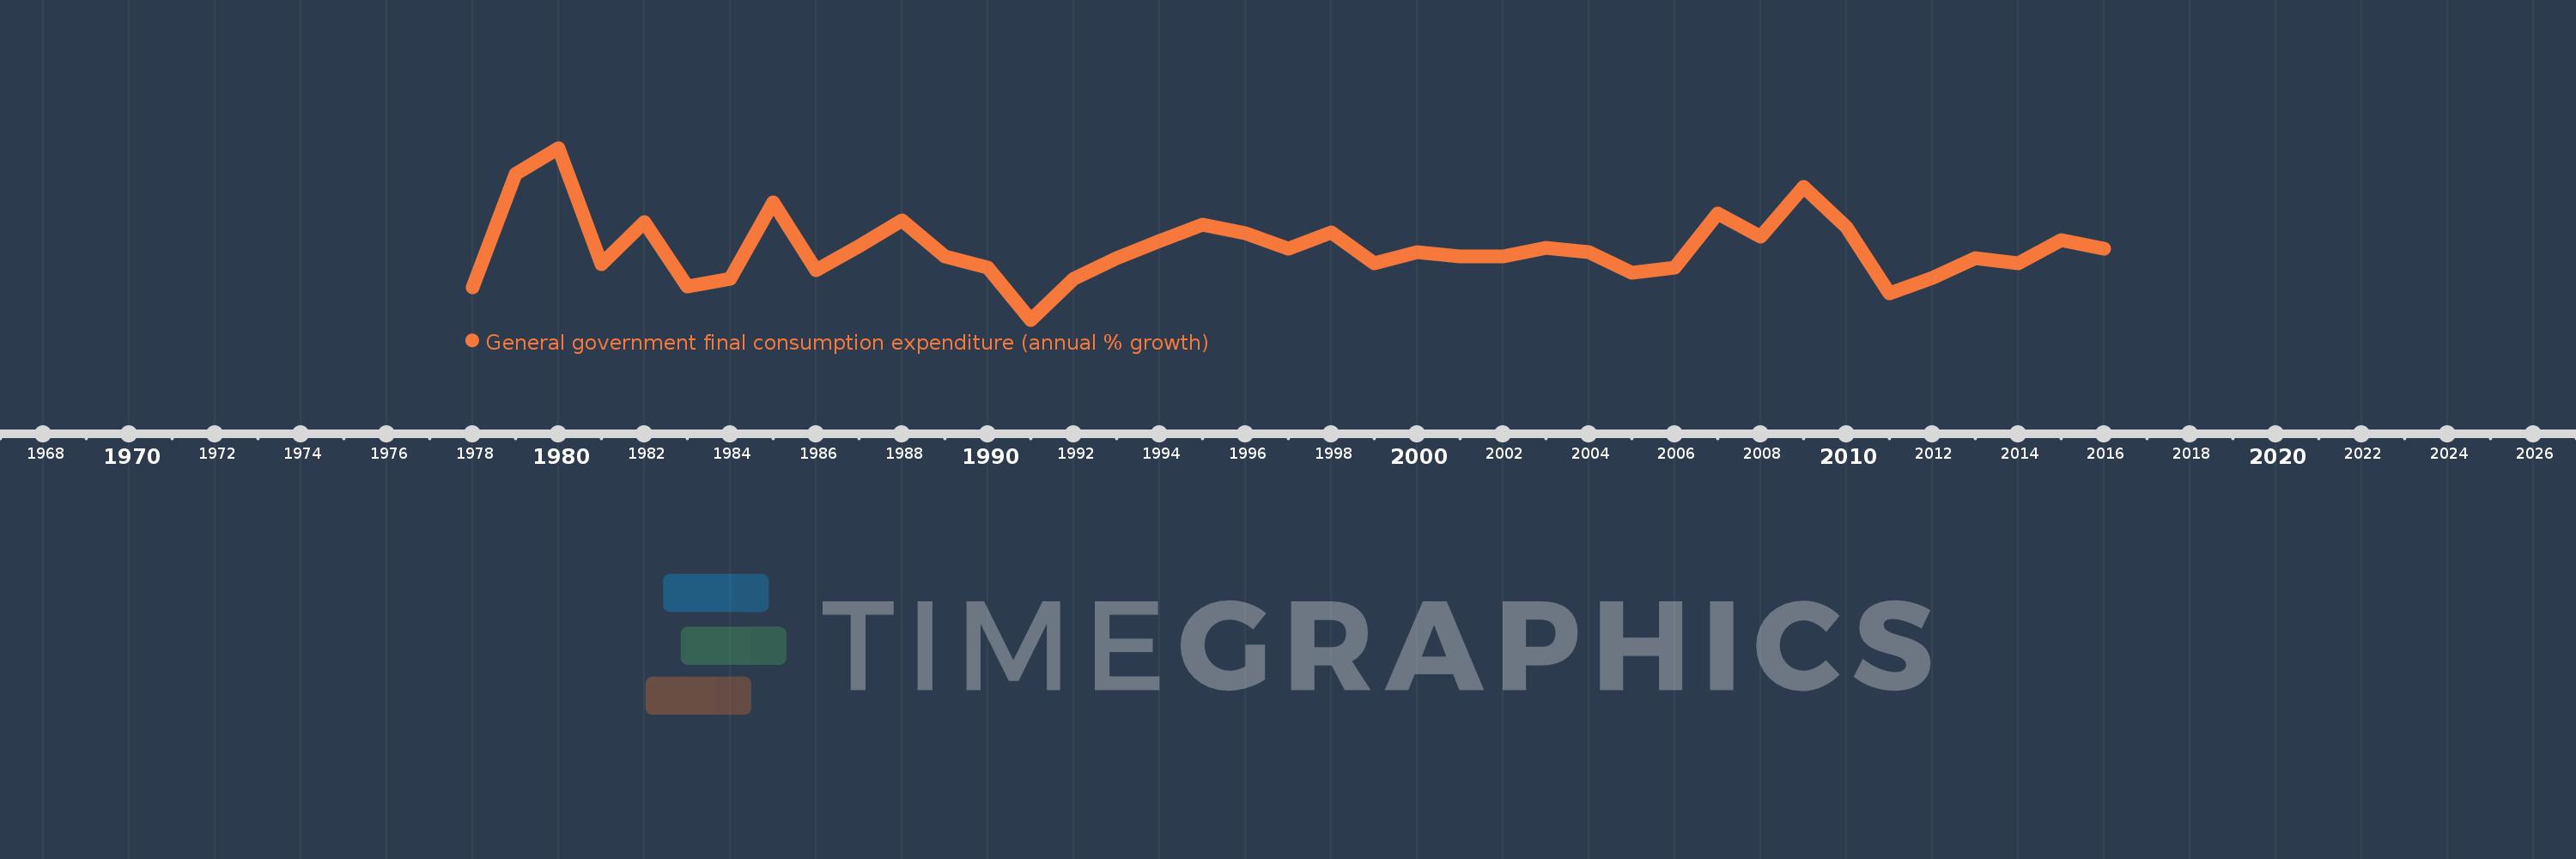
General government final consumption expenditure (annual % growth)
2016,2015,2014,2013,2012,2011,2010,2009,2008,2007,2006,2005,2004,2003,2002,2001,2000,1999,1998,1997,1996,1995,1994,1993,1992,1991,1990,1989,1988,1987,1986,1985,1984,1983,1982,1981,1980,1979,1978
This statistics in other country:
AlbaniaAlgeriaAntigua and BarbudaArab WorldArgentinaArmeniaAustraliaAustriaAzerbaijanBahamas, TheBahrainBangladeshBarbadosBelarusBelgiumBelizeBeninBhutanBoliviaBosnia and HerzegovinaBotswanaBrazilBrunei DarussalamBulgariaBurkina FasoBurundiCabo VerdeCambodiaCameroonCanadaCaribbean small statesCentral Europe and the BalticsChadChileChinaColombiaComorosCongo, Dem. Rep.Congo, Rep.Costa RicaCote d'IvoireCroatiaCubaCyprusCzech RepublicDenmarkDjiboutiDominican RepublicEarly-demographic dividendEast Asia & PacificEast Asia & Pacific (excluding high income)East Asia & Pacific (IDA & IBRD countries)EcuadorEgypt, Arab Rep.El SalvadorEquatorial GuineaEritreaEstoniaEthiopiaEuro areaEurope & Central AsiaEurope & Central Asia (excluding high income)Europe & Central Asia (IDA & IBRD countries)European UnionFijiFinlandFranceGabonGambia, TheGeorgiaGermanyGhanaGreeceGuatemalaGuineaGuinea-BissauHaitiHeavily indebted poor countries (HIPC)High incomeHondurasHong Kong SAR, ChinaHungaryIBRD onlyIcelandIDA & IBRD totalIDA blendIDA onlyIDA totalIndiaIndonesiaIran, Islamic Rep.IrelandIsraelItalyJamaicaJapanJordanKazakhstanKenyaKorea, Rep.KosovoKuwaitKyrgyz RepublicLao PDRLate-demographic dividendLatin America & Caribbean Latin America & Caribbean (excluding high income)Latin America & the Caribbean (IDA & IBRD countries)LatviaLebanonLiberiaLithuaniaLow & middle incomeLow incomeLower middle incomeLuxembourgMacao SAR, ChinaMacedonia, FYRMadagascarMalawiMalaysiaMaliMaltaMauritaniaMauritiusMexicoMiddle East & North AfricaMiddle East & North Africa (excluding high income)Middle East & North Africa (IDA & IBRD countries)Middle incomeMoldovaMongoliaMontenegroMoroccoMozambiqueNamibiaNepalNetherlandsNew ZealandNicaraguaNigerNigeriaNorth AmericaNorwayOECD membersOmanOther small statesPakistanPanamaPapua New GuineaParaguayPeruPhilippinesPolandPortugalPost-demographic dividendPuerto RicoQatarRomaniaRussian FederationRwandaSaudi ArabiaSenegalSerbiaSeychellesSierra LeoneSingaporeSlovak RepublicSloveniaSmall statesSomaliaSouth AfricaSouth AsiaSouth Asia (IDA & IBRD)South SudanSpainSri LankaSub-Saharan Africa Sub-Saharan Africa (excluding high income)Sub-Saharan Africa (IDA & IBRD countries)SudanSurinameSwazilandSwedenSwitzerlandSyrian Arab RepublicTajikistanTanzaniaThailandTimor-LesteTogoTrinidad and TobagoTunisiaTurkeyTurkmenistanUgandaUkraineUnited Arab EmiratesUnited KingdomUnited StatesUpper middle incomeUruguayVanuatuVenezuela, RBVietnamWest Bank and GazaWorldZimbabwe Timeline:
This timeline shows a graph from 1978 to 2016 of Jordan. No data until 1977. Number of actual observations by date: 39.
Source name:
World Development Indicators
Source organization:
World Bank national accounts data, and OECD National Accounts data files.
Categories, topics:
Economy & Growth
Last updated:
apr 23, 2017
Indicators value changes by year
Minimum:
-19.429
jan 1, 1991
Maximum:
36.299
jan 1, 1980
At the date of observation
Value
Absolute change
Change from previous value
jan 1, 1978
-8.871
-8.871
0.0%
jan 1, 1979
27.765
+36.637
-412.98%
jan 1, 1980
36.299
+8.534
30.74%
jan 1, 1981
-1.354
-37.653
-103.73%
jan 1, 1982
12.147
+13.501
-997.17%
jan 1, 1983
-8.528
-20.675
-170.2%
jan 1, 1984
-6.046
+2.482
-29.11%
jan 1, 1985
18.753
+24.799
-410.2%
jan 1, 1986
-3.353
-22.106
-117.88%
jan 1, 1987
4.564
+7.917
-236.15%
jan 1, 1988
12.865
+8.301
181.86%
jan 1, 1989
1.109
-11.756
-91.38%
jan 1, 1990
-2.572
-3.681
-331.94%
jan 1, 1991
-19.429
-16.857
655.33%
jan 1, 1992
-6.215
+13.214
-68.01%
jan 1, 1993
0.599
+6.814
-109.65%
jan 1, 1994
6.236
+5.637
940.32%
jan 1, 1995
11.501
+5.265
84.43%
jan 1, 1996
8.571
-2.93
-25.48%
jan 1, 1997
3.53
-5.041
-58.81%
jan 1, 1998
8.961
+5.431
153.84%
jan 1, 1999
-1.091
-10.051
-112.17%
jan 1, 2000
2.371
+3.461
-317.34%
jan 1, 2001
1.193
-1.178
-49.69%
jan 1, 2002
1.148
-0.045
-3.74%
jan 1, 2003
3.951
+2.803
244.15%
jan 1, 2004
2.419
-1.532
-38.77%
jan 1, 2005
-4.187
-6.606
-273.06%
jan 1, 2006
-2.463
+1.723
-41.16%
jan 1, 2007
15.177
+17.64
-716.07%
jan 1, 2008
7.415
-7.762
-51.14%
jan 1, 2009
23.59
+16.175
218.13%
jan 1, 2010
10.452
-13.138
-55.69%
jan 1, 2011
-10.942
-21.394
-204.69%
jan 1, 2012
-5.919
+5.023
-45.9%
jan 1, 2013
0.592
+6.511
-109.99%
jan 1, 2014
-1.145
-1.737
-293.6%
jan 1, 2015
6.529
+7.674
-670.03%
jan 1, 2016
3.628
-2.9
-44.42%
Ranking of countries by current statistics by years


Comments: