29
/
en
AIzaSyAYiBZKx7MnpbEhh9jyipgxe19OcubqV5w
April 1, 2024
153550
Iceland
ISL
true
2
1
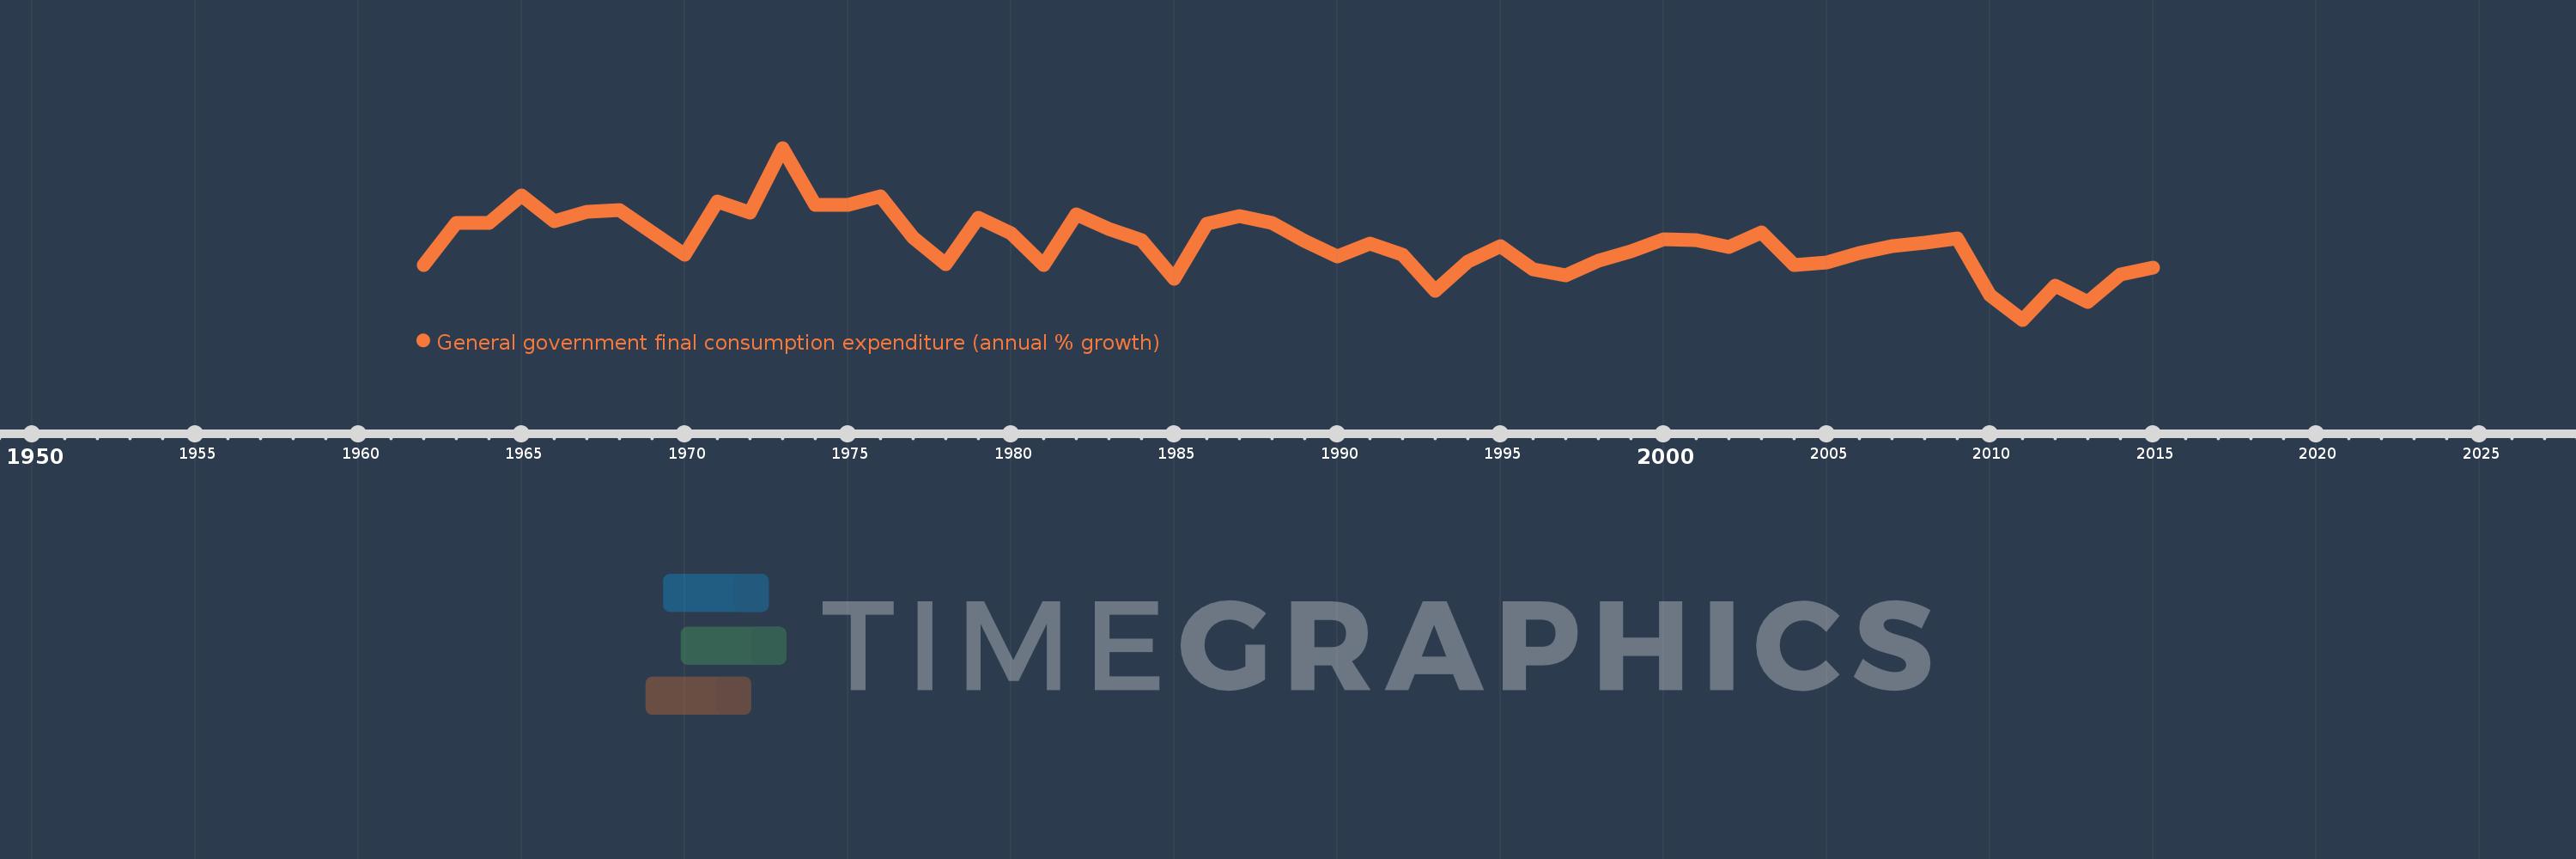
General government final consumption expenditure (annual % growth)
2015,2014,2013,2012,2011,2010,2009,2008,2007,2006,2005,2004,2003,2002,2001,2000,1999,1998,1997,1996,1995,1994,1993,1992,1991,1990,1989,1988,1987,1986,1985,1984,1983,1982,1981,1980,1979,1978,1977,1976,1975,1974,1973,1972,1971,1970,1969,1968,1967,1966,1965,1964,1963,1962
This statistics in other country:
AlbaniaAlgeriaAntigua and BarbudaArab WorldArgentinaArmeniaAustraliaAustriaAzerbaijanBahamas, TheBahrainBangladeshBarbadosBelarusBelgiumBelizeBeninBhutanBoliviaBosnia and HerzegovinaBotswanaBrazilBrunei DarussalamBulgariaBurkina FasoBurundiCabo VerdeCambodiaCameroonCanadaCaribbean small statesCentral Europe and the BalticsChadChileChinaColombiaComorosCongo, Dem. Rep.Congo, Rep.Costa RicaCote d'IvoireCroatiaCubaCyprusCzech RepublicDenmarkDjiboutiDominican RepublicEarly-demographic dividendEast Asia & PacificEast Asia & Pacific (excluding high income)East Asia & Pacific (IDA & IBRD countries)EcuadorEgypt, Arab Rep.El SalvadorEquatorial GuineaEritreaEstoniaEthiopiaEuro areaEurope & Central AsiaEurope & Central Asia (excluding high income)Europe & Central Asia (IDA & IBRD countries)European UnionFijiFinlandFranceGabonGambia, TheGeorgiaGermanyGhanaGreeceGuatemalaGuineaGuinea-BissauHaitiHeavily indebted poor countries (HIPC)High incomeHondurasHong Kong SAR, ChinaHungaryIBRD onlyIcelandIDA & IBRD totalIDA blendIDA onlyIDA totalIndiaIndonesiaIran, Islamic Rep.IrelandIsraelItalyJamaicaJapanJordanKazakhstanKenyaKorea, Rep.KosovoKuwaitKyrgyz RepublicLao PDRLate-demographic dividendLatin America & Caribbean Latin America & Caribbean (excluding high income)Latin America & the Caribbean (IDA & IBRD countries)LatviaLebanonLiberiaLithuaniaLow & middle incomeLow incomeLower middle incomeLuxembourgMacao SAR, ChinaMacedonia, FYRMadagascarMalawiMalaysiaMaliMaltaMauritaniaMauritiusMexicoMiddle East & North AfricaMiddle East & North Africa (excluding high income)Middle East & North Africa (IDA & IBRD countries)Middle incomeMoldovaMongoliaMontenegroMoroccoMozambiqueNamibiaNepalNetherlandsNew ZealandNicaraguaNigerNigeriaNorth AmericaNorwayOECD membersOmanOther small statesPakistanPanamaPapua New GuineaParaguayPeruPhilippinesPolandPortugalPost-demographic dividendPuerto RicoQatarRomaniaRussian FederationRwandaSaudi ArabiaSenegalSerbiaSeychellesSierra LeoneSingaporeSlovak RepublicSloveniaSmall statesSomaliaSouth AfricaSouth AsiaSouth Asia (IDA & IBRD)South SudanSpainSri LankaSub-Saharan Africa Sub-Saharan Africa (excluding high income)Sub-Saharan Africa (IDA & IBRD countries)SudanSurinameSwazilandSwedenSwitzerlandSyrian Arab RepublicTajikistanTanzaniaThailandTimor-LesteTogoTrinidad and TobagoTunisiaTurkeyTurkmenistanUgandaUkraineUnited Arab EmiratesUnited KingdomUnited StatesUpper middle incomeUruguayVanuatuVenezuela, RBVietnamWest Bank and GazaWorldZimbabwe Timeline:
This timeline shows a graph from 1962 to 2015 of Iceland. No data until 1961. Number of actual observations by date: 54.
Source name:
World Development Indicators
Source organization:
World Bank national accounts data, and OECD National Accounts data files.
Categories, topics:
Economy & Growth
Last updated:
apr 23, 2017
Indicators value changes by year
Minimum:
-3.727
jan 1, 2011
Maximum:
14.512
jan 1, 1973
At the date of observation
Value
Absolute change
Change from previous value
jan 1, 1962
2.108
+2.108
0.0%
jan 1, 1963
6.523
+4.415
209.39%
jan 1, 1964
6.59
+0.067
1.03%
jan 1, 1965
9.5
+2.91
44.16%
jan 1, 1966
6.765
-2.736
-28.8%
jan 1, 1967
7.774
+1.01
14.92%
jan 1, 1968
7.955
+0.18
2.32%
jan 1, 1969
5.58
-2.375
-29.85%
jan 1, 1970
3.187
-2.393
-42.88%
jan 1, 1971
8.816
+5.629
176.61%
jan 1, 1972
7.607
-1.21
-13.72%
jan 1, 1973
14.512
+6.905
90.78%
jan 1, 1974
8.495
-6.016
-41.46%
jan 1, 1975
8.475
-0.02
-0.24%
jan 1, 1976
9.334
+0.859
10.14%
jan 1, 1977
5.02
-4.314
-46.21%
jan 1, 1978
2.16
-2.861
-56.98%
jan 1, 1979
7.112
+4.952
229.26%
jan 1, 1980
5.481
-1.631
-22.93%
jan 1, 1981
2.109
-3.372
-61.52%
jan 1, 1982
7.487
+5.377
254.96%
jan 1, 1983
5.938
-1.549
-20.69%
jan 1, 1984
4.684
-1.253
-21.11%
jan 1, 1985
0.583
-4.101
-87.55%
jan 1, 1986
6.492
+5.909
1.01K%
jan 1, 1987
7.252
+0.76
11.72%
jan 1, 1988
6.54
-0.713
-9.83%
jan 1, 1989
4.658
-1.882
-28.78%
jan 1, 1990
3.014
-1.644
-35.3%
jan 1, 1991
4.351
+1.338
44.38%
jan 1, 1992
3.154
-1.197
-27.51%
jan 1, 1993
-0.635
-3.79
-120.14%
jan 1, 1994
2.452
+3.087
-485.97%
jan 1, 1995
4.046
+1.594
65.01%
jan 1, 1996
1.659
-2.386
-58.98%
jan 1, 1997
0.981
-0.678
-40.87%
jan 1, 1998
2.555
+1.573
160.33%
jan 1, 1999
3.562
+1.008
39.45%
jan 1, 2000
4.861
+1.299
36.46%
jan 1, 2001
4.722
-0.139
-2.86%
jan 1, 2002
4.033
-0.689
-14.59%
jan 1, 2003
5.578
+1.545
38.31%
jan 1, 2004
2.105
-3.473
-62.26%
jan 1, 2005
2.397
+0.292
13.88%
jan 1, 2006
3.376
+0.978
40.81%
jan 1, 2007
4.125
+0.749
22.2%
jan 1, 2008
4.458
+0.333
8.07%
jan 1, 2009
4.888
+0.431
9.66%
jan 1, 2010
-1.145
-6.033
-123.42%
jan 1, 2011
-3.727
-2.582
225.56%
jan 1, 2012
-0.148
+3.579
-96.03%
jan 1, 2013
-1.832
-1.684
1.14K%
jan 1, 2014
1.11
+2.942
-160.58%
jan 1, 2015
1.781
+0.671
60.42%
Ranking of countries by current statistics by years


Comments: