29
/
en
AIzaSyAYiBZKx7MnpbEhh9jyipgxe19OcubqV5w
April 1, 2024
155998
Indonesia
IDN
true
2
1
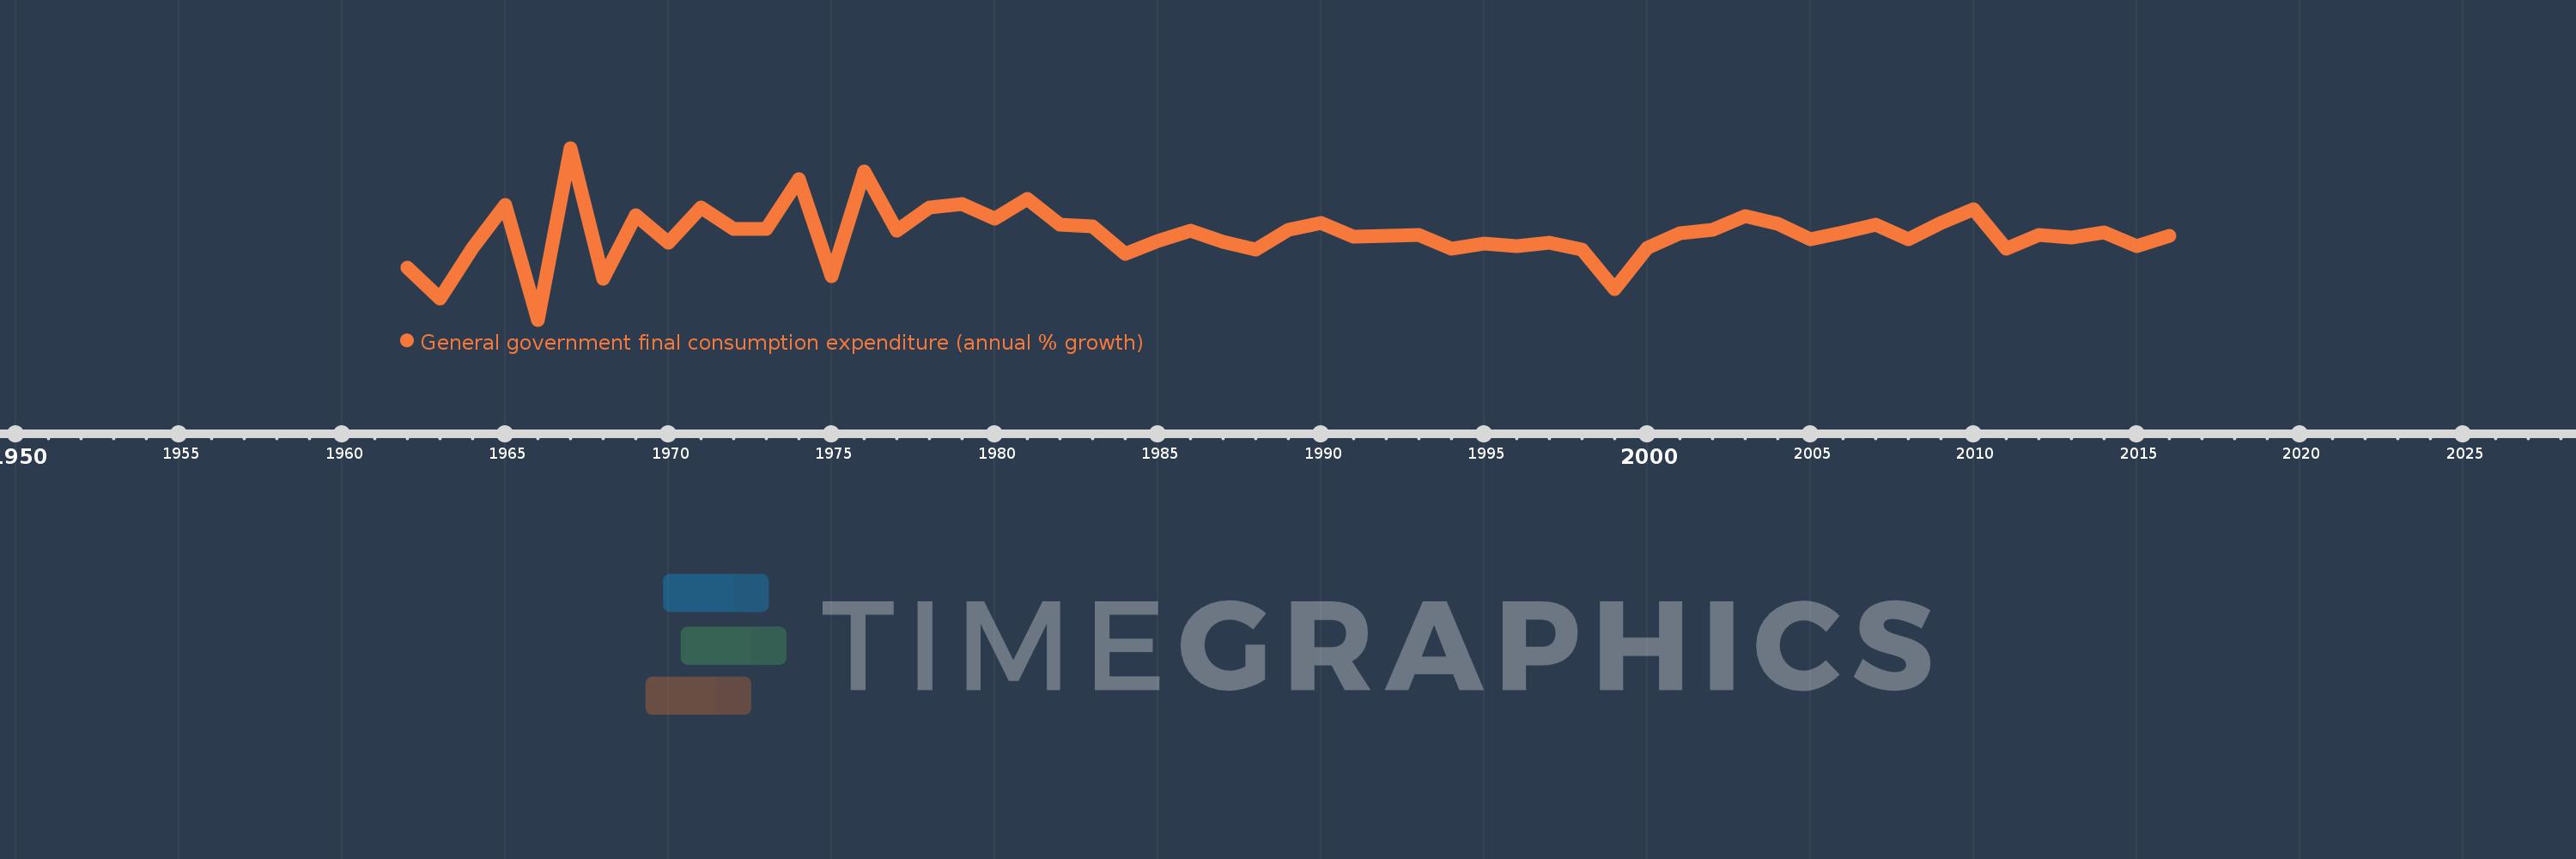
General government final consumption expenditure (annual % growth)
2016,2015,2014,2013,2012,2011,2010,2009,2008,2007,2006,2005,2004,2003,2002,2001,2000,1999,1998,1997,1996,1995,1994,1993,1992,1991,1990,1989,1988,1987,1986,1985,1984,1983,1982,1981,1980,1979,1978,1977,1976,1975,1974,1973,1972,1971,1970,1969,1968,1967,1966,1965,1964,1963,1962
This statistics in other country:
AlbaniaAlgeriaAntigua and BarbudaArab WorldArgentinaArmeniaAustraliaAustriaAzerbaijanBahamas, TheBahrainBangladeshBarbadosBelarusBelgiumBelizeBeninBhutanBoliviaBosnia and HerzegovinaBotswanaBrazilBrunei DarussalamBulgariaBurkina FasoBurundiCabo VerdeCambodiaCameroonCanadaCaribbean small statesCentral Europe and the BalticsChadChileChinaColombiaComorosCongo, Dem. Rep.Congo, Rep.Costa RicaCote d'IvoireCroatiaCubaCyprusCzech RepublicDenmarkDjiboutiDominican RepublicEarly-demographic dividendEast Asia & PacificEast Asia & Pacific (excluding high income)East Asia & Pacific (IDA & IBRD countries)EcuadorEgypt, Arab Rep.El SalvadorEquatorial GuineaEritreaEstoniaEthiopiaEuro areaEurope & Central AsiaEurope & Central Asia (excluding high income)Europe & Central Asia (IDA & IBRD countries)European UnionFijiFinlandFranceGabonGambia, TheGeorgiaGermanyGhanaGreeceGuatemalaGuineaGuinea-BissauHaitiHeavily indebted poor countries (HIPC)High incomeHondurasHong Kong SAR, ChinaHungaryIBRD onlyIcelandIDA & IBRD totalIDA blendIDA onlyIDA totalIndiaIndonesiaIran, Islamic Rep.IrelandIsraelItalyJamaicaJapanJordanKazakhstanKenyaKorea, Rep.KosovoKuwaitKyrgyz RepublicLao PDRLate-demographic dividendLatin America & Caribbean Latin America & Caribbean (excluding high income)Latin America & the Caribbean (IDA & IBRD countries)LatviaLebanonLiberiaLithuaniaLow & middle incomeLow incomeLower middle incomeLuxembourgMacao SAR, ChinaMacedonia, FYRMadagascarMalawiMalaysiaMaliMaltaMauritaniaMauritiusMexicoMiddle East & North AfricaMiddle East & North Africa (excluding high income)Middle East & North Africa (IDA & IBRD countries)Middle incomeMoldovaMongoliaMontenegroMoroccoMozambiqueNamibiaNepalNetherlandsNew ZealandNicaraguaNigerNigeriaNorth AmericaNorwayOECD membersOmanOther small statesPakistanPanamaPapua New GuineaParaguayPeruPhilippinesPolandPortugalPost-demographic dividendPuerto RicoQatarRomaniaRussian FederationRwandaSaudi ArabiaSenegalSerbiaSeychellesSierra LeoneSingaporeSlovak RepublicSloveniaSmall statesSomaliaSouth AfricaSouth AsiaSouth Asia (IDA & IBRD)South SudanSpainSri LankaSub-Saharan Africa Sub-Saharan Africa (excluding high income)Sub-Saharan Africa (IDA & IBRD countries)SudanSurinameSwazilandSwedenSwitzerlandSyrian Arab RepublicTajikistanTanzaniaThailandTimor-LesteTogoTrinidad and TobagoTunisiaTurkeyTurkmenistanUgandaUkraineUnited Arab EmiratesUnited KingdomUnited StatesUpper middle incomeUruguayVanuatuVenezuela, RBVietnamWest Bank and GazaWorldZimbabwe Timeline:
This timeline shows a graph from 1962 to 2016 of Indonesia. No data until 1961. Number of actual observations by date: 55.
Source name:
World Development Indicators
Source organization:
World Bank national accounts data, and OECD National Accounts data files.
Categories, topics:
Economy & Growth
Last updated:
apr 23, 2017
Indicators value changes by year
Minimum:
-27.526
jan 1, 1966
Maximum:
39.721
jan 1, 1967
At the date of observation
Value
Absolute change
Change from previous value
jan 1, 1962
-7.158
-7.158
0.0%
jan 1, 1963
-19.277
-12.119
169.29%
jan 1, 1964
0.597
+19.874
-103.1%
jan 1, 1965
17.507
+16.91
2.83K%
jan 1, 1966
-27.526
-45.032
-257.23%
jan 1, 1967
39.721
+67.247
-244.31%
jan 1, 1968
-11.471
-51.192
-128.88%
jan 1, 1969
13.24
+24.711
-215.42%
jan 1, 1970
2.488
-10.752
-81.21%
jan 1, 1971
16.505
+14.017
563.48%
jan 1, 1972
8.125
-8.38
-50.77%
jan 1, 1973
8.093
-0.033
-0.4%
jan 1, 1974
27.629
+19.536
241.41%
jan 1, 1975
-10.475
-38.104
-137.91%
jan 1, 1976
30.421
+40.896
-390.42%
jan 1, 1977
7.297
-23.124
-76.01%
jan 1, 1978
16.387
+9.091
124.58%
jan 1, 1979
17.625
+1.237
7.55%
jan 1, 1980
11.999
-5.626
-31.92%
jan 1, 1981
19.688
+7.689
64.08%
jan 1, 1982
9.844
-9.843
-50.0%
jan 1, 1983
8.996
-0.848
-8.61%
jan 1, 1984
-1.859
-10.855
-120.66%
jan 1, 1985
3.417
+5.276
-283.83%
jan 1, 1986
7.446
+4.029
117.9%
jan 1, 1987
2.964
-4.482
-60.19%
jan 1, 1988
-0.173
-3.137
-105.84%
jan 1, 1989
7.577
+7.75
-4.48K%
jan 1, 1990
10.303
+2.726
35.98%
jan 1, 1991
4.835
-5.468
-53.07%
jan 1, 1992
5.263
+0.429
8.87%
jan 1, 1993
5.727
+0.464
8.81%
jan 1, 1994
0.183
-5.544
-96.81%
jan 1, 1995
2.305
+2.122
1.16K%
jan 1, 1996
1.342
-0.963
-41.8%
jan 1, 1997
2.692
+1.35
100.64%
jan 1, 1998
0.061
-2.63
-97.73%
jan 1, 1999
-15.372
-15.433
-25.21K%
jan 1, 2000
0.695
+16.066
-104.52%
jan 1, 2001
6.491
+5.796
834.23%
jan 1, 2002
7.564
+1.073
16.53%
jan 1, 2003
12.993
+5.43
71.79%
jan 1, 2004
10.034
-2.96
-22.78%
jan 1, 2005
3.99
-6.043
-60.23%
jan 1, 2006
6.635
+2.645
66.28%
jan 1, 2007
9.61
+2.975
44.84%
jan 1, 2008
3.894
-5.717
-59.48%
jan 1, 2009
10.428
+6.534
167.81%
jan 1, 2010
15.675
+5.247
50.31%
jan 1, 2011
0.324
-15.351
-97.93%
jan 1, 2012
5.518
+5.194
1.6K%
jan 1, 2013
4.527
-0.992
-17.97%
jan 1, 2014
6.746
+2.219
49.02%
jan 1, 2015
1.164
-5.582
-82.75%
jan 1, 2016
5.384
+4.22
362.59%
Ranking of countries by current statistics by years


Comments: