29
/
en
AIzaSyAYiBZKx7MnpbEhh9jyipgxe19OcubqV5w
April 1, 2024
187801
Malaysia
MYS
true
2
1
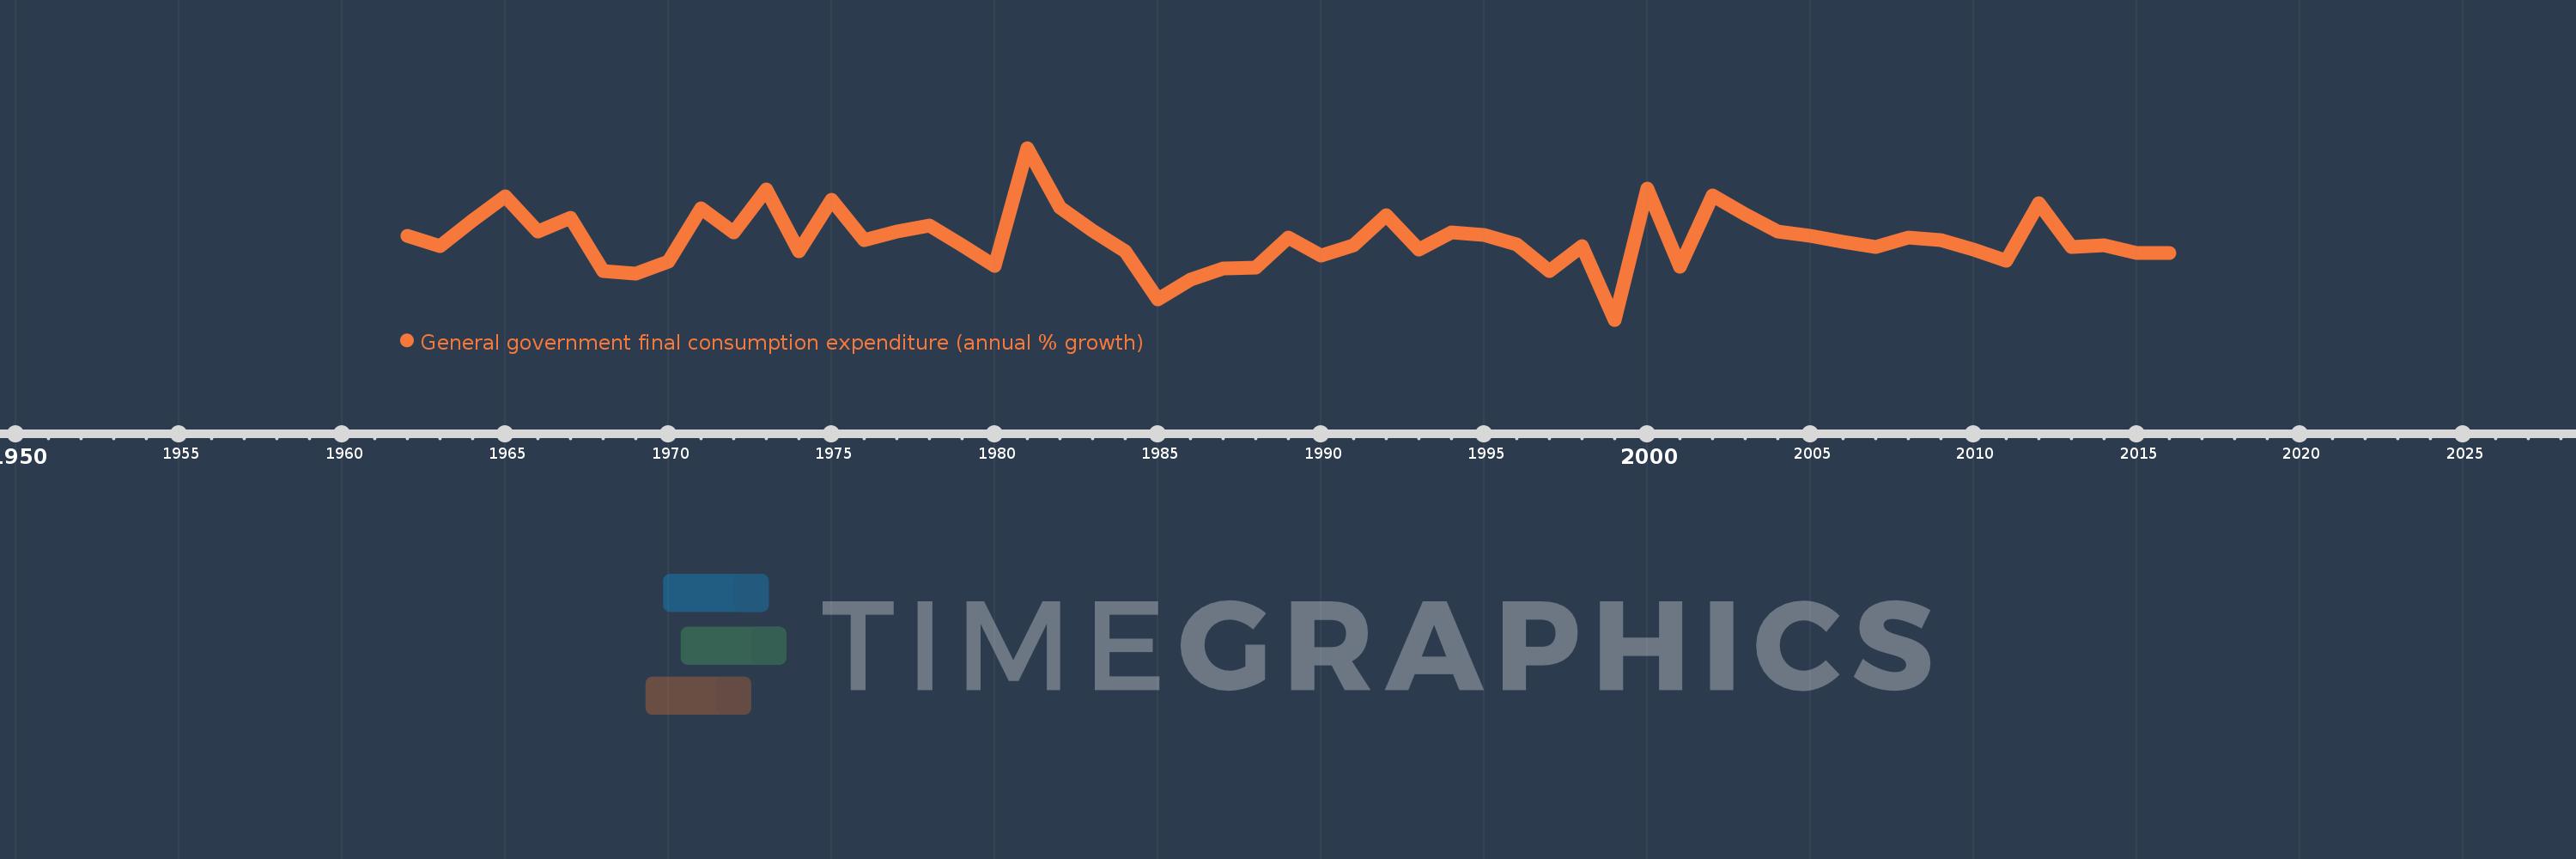
General government final consumption expenditure (annual % growth)
2016,2015,2014,2013,2012,2011,2010,2009,2008,2007,2006,2005,2004,2003,2002,2001,2000,1999,1998,1997,1996,1995,1994,1993,1992,1991,1990,1989,1988,1987,1986,1985,1984,1983,1982,1981,1980,1979,1978,1977,1976,1975,1974,1973,1972,1971,1970,1969,1968,1967,1966,1965,1964,1963,1962
This statistics in other country:
AlbaniaAlgeriaAntigua and BarbudaArab WorldArgentinaArmeniaAustraliaAustriaAzerbaijanBahamas, TheBahrainBangladeshBarbadosBelarusBelgiumBelizeBeninBhutanBoliviaBosnia and HerzegovinaBotswanaBrazilBrunei DarussalamBulgariaBurkina FasoBurundiCabo VerdeCambodiaCameroonCanadaCaribbean small statesCentral Europe and the BalticsChadChileChinaColombiaComorosCongo, Dem. Rep.Congo, Rep.Costa RicaCote d'IvoireCroatiaCubaCyprusCzech RepublicDenmarkDjiboutiDominican RepublicEarly-demographic dividendEast Asia & PacificEast Asia & Pacific (excluding high income)East Asia & Pacific (IDA & IBRD countries)EcuadorEgypt, Arab Rep.El SalvadorEquatorial GuineaEritreaEstoniaEthiopiaEuro areaEurope & Central AsiaEurope & Central Asia (excluding high income)Europe & Central Asia (IDA & IBRD countries)European UnionFijiFinlandFranceGabonGambia, TheGeorgiaGermanyGhanaGreeceGuatemalaGuineaGuinea-BissauHaitiHeavily indebted poor countries (HIPC)High incomeHondurasHong Kong SAR, ChinaHungaryIBRD onlyIcelandIDA & IBRD totalIDA blendIDA onlyIDA totalIndiaIndonesiaIran, Islamic Rep.IrelandIsraelItalyJamaicaJapanJordanKazakhstanKenyaKorea, Rep.KosovoKuwaitKyrgyz RepublicLao PDRLate-demographic dividendLatin America & Caribbean Latin America & Caribbean (excluding high income)Latin America & the Caribbean (IDA & IBRD countries)LatviaLebanonLiberiaLithuaniaLow & middle incomeLow incomeLower middle incomeLuxembourgMacao SAR, ChinaMacedonia, FYRMadagascarMalawiMalaysiaMaliMaltaMauritaniaMauritiusMexicoMiddle East & North AfricaMiddle East & North Africa (excluding high income)Middle East & North Africa (IDA & IBRD countries)Middle incomeMoldovaMongoliaMontenegroMoroccoMozambiqueNamibiaNepalNetherlandsNew ZealandNicaraguaNigerNigeriaNorth AmericaNorwayOECD membersOmanOther small statesPakistanPanamaPapua New GuineaParaguayPeruPhilippinesPolandPortugalPost-demographic dividendPuerto RicoQatarRomaniaRussian FederationRwandaSaudi ArabiaSenegalSerbiaSeychellesSierra LeoneSingaporeSlovak RepublicSloveniaSmall statesSomaliaSouth AfricaSouth AsiaSouth Asia (IDA & IBRD)South SudanSpainSri LankaSub-Saharan Africa Sub-Saharan Africa (excluding high income)Sub-Saharan Africa (IDA & IBRD countries)SudanSurinameSwazilandSwedenSwitzerlandSyrian Arab RepublicTajikistanTanzaniaThailandTimor-LesteTogoTrinidad and TobagoTunisiaTurkeyTurkmenistanUgandaUkraineUnited Arab EmiratesUnited KingdomUnited StatesUpper middle incomeUruguayVanuatuVenezuela, RBVietnamWest Bank and GazaWorldZimbabwe Timeline:
This timeline shows a graph from 1962 to 2016 of Malaysia. No data until 1961. Number of actual observations by date: 55.
Source name:
World Development Indicators
Source organization:
World Bank national accounts data, and OECD National Accounts data files.
Categories, topics:
Economy & Growth
Last updated:
apr 23, 2017
Indicators value changes by year
Minimum:
-8.893
jan 1, 1999
Maximum:
25.101
jan 1, 1981
At the date of observation
Value
Absolute change
Change from previous value
jan 1, 1962
7.719
+7.719
0.0%
jan 1, 1963
5.746
-1.973
-25.57%
jan 1, 1964
10.745
+4.999
87.01%
jan 1, 1965
15.491
+4.746
44.17%
jan 1, 1966
8.544
-6.946
-44.84%
jan 1, 1967
11.302
+2.758
32.27%
jan 1, 1968
0.751
-10.551
-93.36%
jan 1, 1969
0.235
-0.515
-68.66%
jan 1, 1970
2.66
+2.425
1.03K%
jan 1, 1971
13.186
+10.526
395.64%
jan 1, 1972
8.384
-4.802
-36.42%
jan 1, 1973
16.9
+8.516
101.57%
jan 1, 1974
4.571
-12.329
-72.95%
jan 1, 1975
14.917
+10.347
226.36%
jan 1, 1976
6.789
-8.128
-54.49%
jan 1, 1977
8.49
+1.701
25.06%
jan 1, 1978
9.83
+1.34
15.78%
jan 1, 1979
5.839
-3.991
-40.6%
jan 1, 1980
1.724
-4.115
-70.47%
jan 1, 1981
25.101
+23.377
1.36K%
jan 1, 1982
13.342
-11.759
-46.85%
jan 1, 1983
8.743
-4.599
-34.47%
jan 1, 1984
4.575
-4.168
-47.67%
jan 1, 1985
-4.895
-9.47
-207.0%
jan 1, 1986
-0.874
+4.022
-82.15%
jan 1, 1987
1.264
+2.137
-244.64%
jan 1, 1988
1.468
+0.204
16.18%
jan 1, 1989
7.355
+5.887
400.97%
jan 1, 1990
3.723
-3.632
-49.38%
jan 1, 1991
5.883
+2.16
58.02%
jan 1, 1992
11.745
+5.862
99.65%
jan 1, 1993
4.934
-6.811
-57.99%
jan 1, 1994
8.427
+3.493
70.78%
jan 1, 1995
7.866
-0.561
-6.66%
jan 1, 1996
6.062
-1.804
-22.94%
jan 1, 1997
0.73
-5.331
-87.96%
jan 1, 1998
5.683
+4.953
678.43%
jan 1, 1999
-8.893
-14.576
-256.48%
jan 1, 2000
17.08
+25.973
-292.05%
jan 1, 2001
1.631
-15.449
-90.45%
jan 1, 2002
15.703
+14.072
862.88%
jan 1, 2003
11.89
-3.813
-24.28%
jan 1, 2004
8.607
-3.283
-27.61%
jan 1, 2005
7.642
-0.965
-11.21%
jan 1, 2006
6.5
-1.143
-14.95%
jan 1, 2007
5.488
-1.011
-15.56%
jan 1, 2008
7.331
+1.843
33.58%
jan 1, 2009
6.872
-0.459
-6.27%
jan 1, 2010
4.943
-1.929
-28.07%
jan 1, 2011
2.759
-2.183
-44.17%
jan 1, 2012
14.162
+11.403
413.26%
jan 1, 2013
5.431
-8.731
-61.65%
jan 1, 2014
5.806
+0.375
6.9%
jan 1, 2015
4.297
-1.509
-25.99%
jan 1, 2016
4.356
+0.06
1.39%
Ranking of countries by current statistics by years


Comments: